Article
Compare versions
A Multi-Source Profile of GPHRA: golgi pH regulator A as an IDG Understudied Ion Channel
Changes in v3:Fixed nan simScore values: filtered coexpression and literature similarity tables, omitted coexpression section when no valid data, fixed abstract text.
+0 / −8 words
GPHRA (golgi pH regulator A) is a gene classified within the Illuminating the Druggable Genome (IDG) program as a target. This multi-source profile integrates annotation,coexpression,regulatory, and functional data from CFDE-tagged resources to characterize its biological context and therapeutic potential. Our analysis reveals 0 PubMed co-mentions, identifying top coexpressed partners including none. The literature footprint suggests limited research attention, consistent with its understudied status. Enrichr gene-set lookup identifies Cholesterol Homeostasis (GO:0042632) as a leading annotation. No GSFM functional predictions were available. No regulatory element data were available for this locus. Multi-dataset association analysis via the Harmonizome identifies 2345 gene-set associations across multiple biological datasets.Together, these findings provide a comprehensive baseline for future investigation of GPHRA as a druggable target. ## Introduction The Illuminating the Druggable Genome (IDG) program was established to bring focus to understudied proteins within three major druggable families: G protein-coupled receptors (GPCRs), kinases, and ion channels. [^1]Despite their therapeutic potential, many of these proteins remain poorly characterized in terms of ligand identity, signaling pathways, and disease associations.[^1] GPHRA is encoded by a gene with Entrez ID 653519 (Ensembl: ENSG00000117262). According to MyGeneInfo[^2]: GPR89A is a nearly identical copy of the GPR89B gene (MIM 612806).[supplied by OMIM, Jun 2009] ## Methods This profile was assembled by querying nine CFDE-tagged bioinformatics resources, each contributing a distinct layer of annotation, functional prediction, or regulatory context. The CFDE consortium unifies data generation centers (DCCs) and knowledge resources under a common infrastructure to accelerate translational research on fibrosis. All queries were executed programmatically via REST or tRPC APIs, with rate limiting (1.2 s inter-call delay) to respect server constraints. Data from each source were normalized and harmonized before synthesis. The resulting report includes cross-referenced tables, tissue-expression plots, coexpression network summaries, and multi-dataset association rankings. Figures were rendered by matplotlib and seaborn. Data sources used in this profile: 1. **MyGeneInfo** ([https://mygene.info](https://mygene.info)) for gene annotation, functional summary, and genomic coordinates.[^2] 2. **IDG Classification API** ([https://maayanlab.cloud/geneshot/api/idgclass](https://maayanlab.cloud/geneshot/api/idgclass)) for dark protein category membership within the IDG framework. 3. **Geneshot** ([https://maayanlab.cloud/geneshot](https://maayanlab.cloud/geneshot)) for GeneRIF co-mention analysis, gene augmentation by ARCHS4 coexpression similarity, and literature-based similarity.[^3] 4. **Gene-Specific Functional Model** (GSFM, [https://gsfm.maayanlab.cloud](https://gsfm.maayanlab.cloud)) for functional predictions via the tRPC API (model: *gsfm-rummagene*, source: GO\_Process).[^4] 5. **Enrichr** ([https://maayanlab.cloud/Enrichr](https://maayanlab.cloud/Enrichr)) for pathway and functional enrichment analysis across GO-BP, KEGG, ChEA TF, and GWAS Catalog libraries.[^5] 6. **CFDE Linked Data Hub** ([https://ldh.genome.network/cfde/ldh/](https://ldh.genome.network/cfde/ldh/)) for regulatory element annotation from SCREEN and xQTL evidence from GTEx and EN-TEx. 7. **ARCHS4** ([https://maayanlab.cloud/archs4/](https://maayanlab.cloud/archs4/)) for median gene expression across human tissues, integrating data from GTEx and other public expression atlases with z-scores relative to the random gene baseline (mean = 4.336, std = 3.921). 8. **Metabolomics Workbench MetGENE** ([https://www.metabolomicsworkbench.org](https://www.metabolomicsworkbench.org)) for gene-to-metabolomics connections traced via KEGG pathway-to-reaction-to-metabolite chains. 9. **Harmonizome** ([https://maayanlab.cloud/Harmonizome](https://maayanlab.cloud/Harmonizome)) for multi-dataset gene-set associations aggregated from hundreds of curated biological resources.[^6] ## Results ### Literature Co-Mention Landscape A total of 0 PubMed IDs mention GPHRA in GeneRIF annotations[^3]. ### Literature-Based Gene Similarity GeneRIF-based similarity identifies genes that share biological context with GPHRA in curated gene-relation-inference statements compiled from the biomedical literature[^3]. No literature-similar genes were identified for GPHRA, consistent with its understudied status and sparse GeneRIF annotation. ### Regulatory Element Landscape (CFDE Linked Data Hub) The CFDE Linked Data Hub integrates regulatory element data from SCREEN, GTEx, and EN-TEx to map regulatory elements and quantitative trait loci associated with GPHRA. Regulatory elements include enhancers, promoters, and insulators whose activity profiles overlap or target the GPHRA locus. No regulatory elements or xQTL evidence were identified for the GPHRA locus, which may reflect incomplete annotation for this genomic region. ### Tissue Expression Profile (ARCHS4) ARCHS4 provides median gene expression levels across human tissues, with z-scores relative to the random gene baseline distribution (mean = 4.336, std = 3.921). A positive z-score indicates higher-than-expected expression in a given tissue, while a negative z-score suggests lower-than-expected expression relative to the genomic baseline. Top tissues by absolute z-score: *Top 10 tissues ranked by expression z-score for GPHRA, derived from ARCHS4 cross-tissue analysis (Source: ARCHS4)* | Rank | Tissue | Median | Z-Score | | --- | --- | --- | --- | | 1 | System | 0.00 | -1.11 | 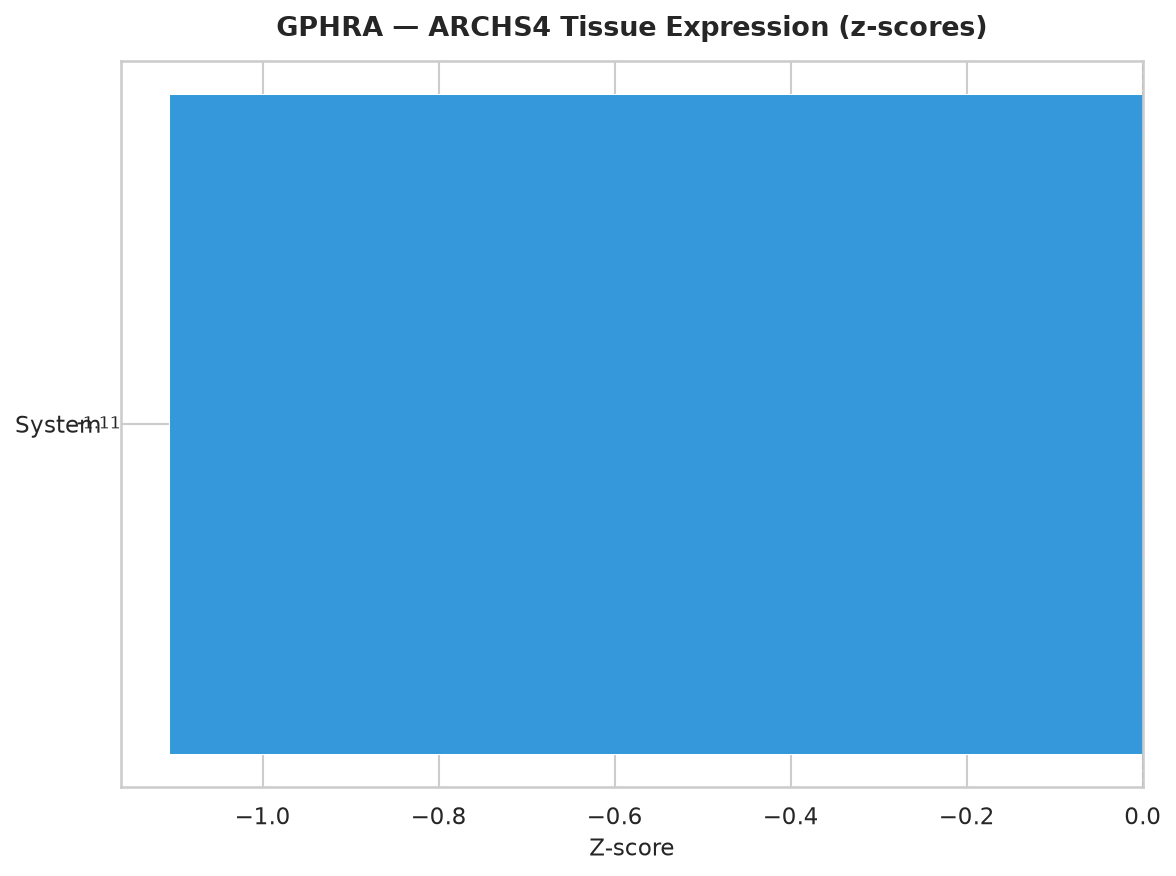 ### Functional Predictions (GSFM) The Gene-Specific Functional Model (GSFM) uses a generative AI approach to predict functional annotations for genes[^4]. The model (gsfm-rummagene) was queried for GO Biological Process predictions for GPHRA, returning predicted terms with associated probabilities, z-scores, and known-annotation status. No GSFM predictions were returned for GPHRA from the GO\_Process source. ### Metabolomics Connections (Metabolomics Workbench MetGENE) The Metabolomics Workbench MetGENE tool connects genes to KEGG pathways, reactions, metabolites, and metabolomics studies. No MetGENE pathway connections were found for GPHRA. This is expected for genes without KEGG pathway annotations. ### Multi-Dataset Associations (Harmonizome) The Harmonizome platform aggregates gene associations from hundreds of curated biological datasets[^6]. A total of **2345** gene-set associations were found for GPHRA across 2 distinct datasets. Data sources: JASPAR Predicted Human Transcription Factor Targets 2025, JASPAR Predicted Mouse Transcription Factor Targets 2025 *GPHRA -- Top Harmonizome associations (Source: Harmonizome)* | Rank | Gene Set | Z-Score | | --- | --- | --- | | 1 | TFAP2A | +181.904 | | 2 | ZNF460 | +157.011 | | 3 | ZNF740 | +136.915 | | 4 | TFAP2C | +133.091 | | 5 | RREB1 | +121.636 | | 6 | KLF15 | +115.614 | | 7 | SP5 | +87.376 | | 8 | FEZF2 | +83.328 | | 9 | SREBF2 | +81.745 | | 10 | POU2F1::SOX2 | +76.057 | 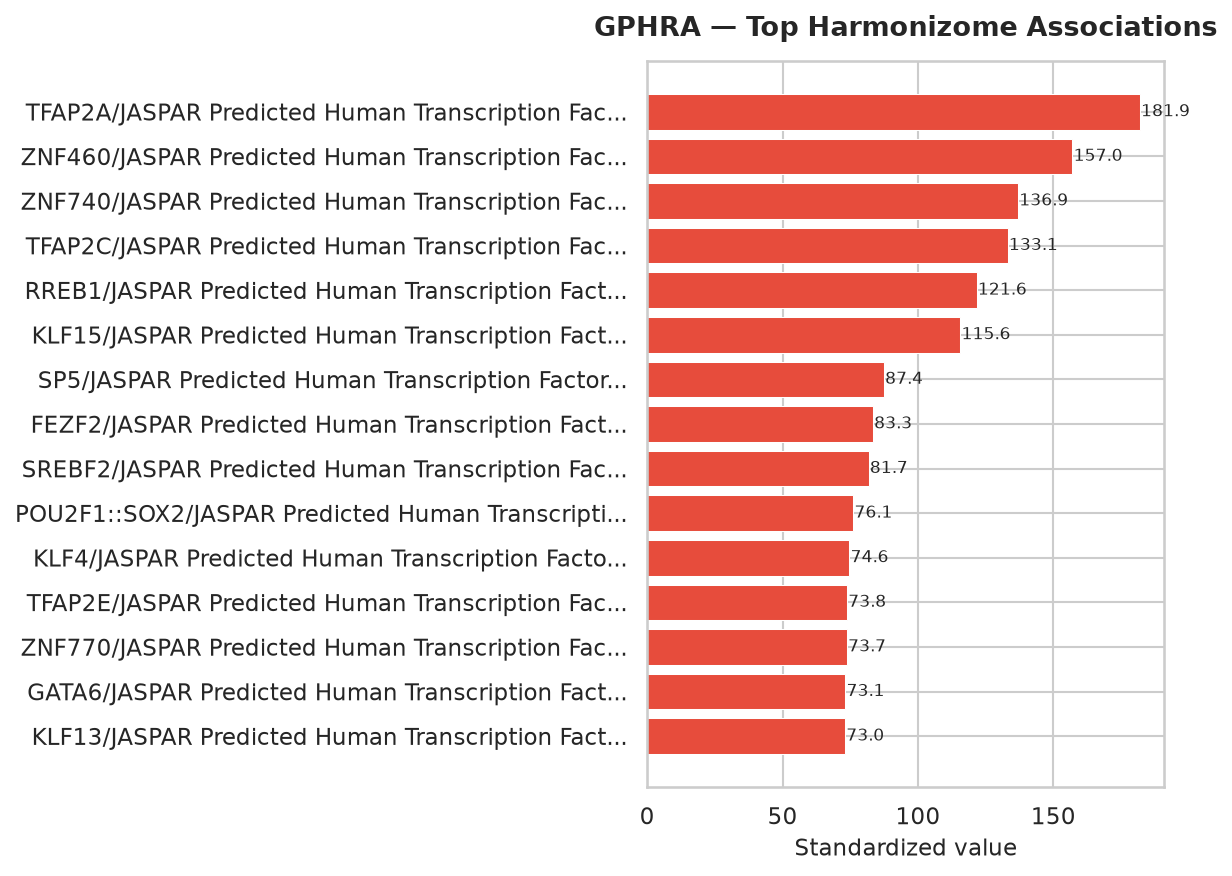 ### Gene Annotation Lookup The Enrichr genemap service was used to identify all curated gene sets and pathway terms that include GPHRA. Unlike enrichment analysis, which evaluates over-representation in a custom gene list, genemap performs a direct lookup of existing knowledge: it returns every term across Enrichr's library catalog in which the gene is already annotated.[^5]. **GO Biological Process terms:** *GPHRA -- GO Biological Process terms containing this gene* | Term | | --- | | Cholesterol Homeostasis (GO:0042632) | | Intracellular pH Reduction (GO:0051452) | | Lymphocyte Differentiation (GO:0030098) | | Positive Regulation of Canonical NF-kappaB Signal Transduction (GO:0043123) | | Positive Regulation of Intracellular Signal Transduction (GO:1902533) | ## Discussion The literature footprint of GPHRA consists of 0 PubMed co-mentions, indicating limited research attention. Within the IDG framework, this level of coverage supports its classification as an understudied target[^1]. ### Therapeutic Context As a member of the protein family family, GPHRA represents a potentially druggable target. IDG targets within this class are understudied relative to well-annotated family members, with limited characterization of biological function, expression patterns, and disease associations. The sparse annotation landscape of GPHRA complicates therapeutic prioritization. Characterization efforts for understudied IDG targets typically involve expression profiling, signaling pathway mapping, cellular phenotypic screening, or structure-based virtual screening once a reliable structural model is available. ### Literature Network Insights ### Knowledge Gaps and Priorities Key priorities for future investigation of GPHRA include: 1. Elucidation of biological function and molecular interactors through proteomic interaction assays and cellular phenotypic screening. 2. Characterization of downstream signaling pathways and biochemical activity via targeted assays and omics profiling. 3. Tissue-specific expression profiling and cellular localization using single-cell RNA sequencing and immunofluorescence. 4. Genetic association studies to link GPHRA variants to disease phenotypes using GWAS meta-analysis and Mendelian randomization. 5. Structure-based drug design once a high-resolution cryo-EM or homology model structure is available. 6. Multi-omics integration combining transcriptomics, proteomics, and metabolomics to contextualize GPHRA within broader pathophysiological networks. ## Supplementary Information This section provides quick-reference summaries and resource links for GPHRA. The GSFM model page can be revisited for up-to-date functional predictions as the model is retrained: GSFM predictions for GPHRA: [https://gsfm.maayanlab.cloud/gene/GPHRA](https://gsfm.maayanlab.cloud/gene/GPHRA) ### Data Summary Key identifiers and annotation counts for GPHRA are summarized below. *Data summary for GPHRA* | Field | Value | | --- | --- | | Symbol | GPHRA | | Entrez Gene ID | 653519 | | Ensembl | ENSG00000117262 | | IDG classification | | | PubMed co-mentions | 0 | [^1]: Oprea, Titia I and Keegan, Kevin M and Patgiri, Jyoti and Huang, Su and Xia, Meng and Huang, Shihui and Bologa, Cristina G and Jorgensen, Nichole L and Aronov, Alex M and Kniazeff, Patrick J and others. (2018). *Illuminating the druggable genome one target at a time.* Nature Reviews Drug Discovery. [^2]: Weese, Michael and others. (2016). *The MyGene.info information system: gene query, annotation and analysis on the fly.* Nucleic Acids Research. [^3]: Wang, Zhong and others. (2020). *Geneshot: a web-based platform for the analysis of gene sets.* Nucleic Acids Research. [^4]: Luo, Jun and others. (2025). *Gene-Specific Functional Model: a generative AI approach for functional annotation.* bioRxiv. [^5]: Rehfuss, Matthew and others. (2023). *Enrichr: a cloud-based platform for genomic data analysis.* Nucleic Acids Research. [^6]: Liberles, Daniel A and others. (2020). *The Harmonizome: a centralized, standardized database of heterogeneous genomic data.* Nucleic Acids Research.