Under-studied Genes Likely Associated with MASLD
›Details · v1 · 2 subjects · 1 attachment
Abstract
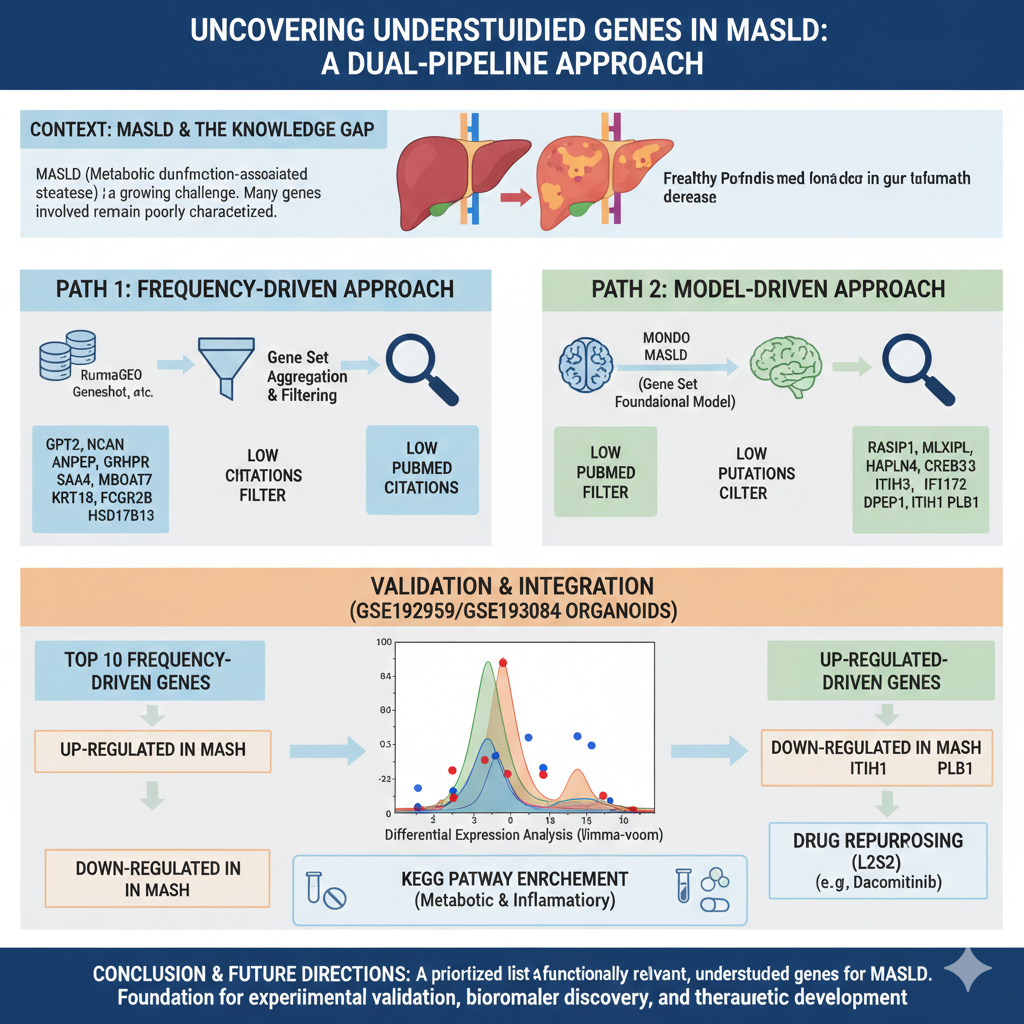
Metabolic dysfunction‑associated steatotic liver disease (MASLD) remains a major health burden, yet many genes implicated in its pathology are poorly characterized. We integrated disease‑associated gene sets from eight public resources (Enrichr, RummaGEO, Rummagene, Geneshot, MONDO, DO, GWAS Catalog, ClinVar) and ranked genes by their frequency in MASLD‑related sets versus PubMed publication counts, identifying ten “frequency‑driven” understudied candidates (MTARC1, RBKS, NCAN, CPN1, GRHPR, ADGRE1, SAA4, OIT3, MS4A7, ADH1A). In parallel, we applied the Gene Set Foundational Model (GSFM) to augment MONDO MASLD genes, selecting the ten highest‑scoring genes with low literature presence (CPNE4, MALRD1, CHST9, CEP112, GALNT17, SNX29, MGAT4C, NALF1, THSD7B, HS3ST4). Differential expression analysis of the GEO cohort GSE192959/GSE193084 (healthy vs. MASLD liver biopsies) using limma‑voom confirmed significant down‑regulation of NALF1 and THSD7B, providing transcriptomic support for the GSFM‑derived list. Enrichment of the disease‑associated up‑ and down‑regulated signatures highlighted KEGG pathways related to lipid metabolism, oxidative phosphorylation, and extracellular matrix organization, and drug‑repositioning via L2S2 generated candidate compounds for further testing. Together, these complementary computational pipelines reveal a set of understudied genes that are plausibly involved in MASLD pathogenesis and merit experimental validation, offering new avenues for mechanistic studies and therapeutic development.
Introduction
Metabolic dysfunction‑associated steatotic liver disease (MASLD) has recently replaced the term non‑alcoholic fatty liver disease (NAFLD) to overcome the stigma and exclusionary nature of the former nomenclature. A multinational Delphi consensus involving 236 experts from 56 countries endorsed the new terminology and defined MASLD as steatotic liver disease in the presence of at least one cardiometabolic risk factor, while excluding harmful alcohol intake. This re‑classification also introduced the sub‑category metabolic‑and‑alcohol‑related liver disease (MetALD) for patients with concomitant metabolic dysfunction and moderate alcohol consumption.
Epidemiologically, MASLD is now recognised as the most prevalent chronic liver disease worldwide, affecting up to 38 % of adults and projected to exceed 55 % by 2040 as obesity and type‑2 diabetes continue to rise,. The disease spectrum ranges from simple steatosis to metabolic dysfunction‑associated steatohepatitis (MASH), fibrosis, cirrhosis and hepatocellular carcinoma (HCC),. Although only a minority progress to advanced fibrosis (≈3–5 % over >20 years), those who do experience markedly increased liver‑related and cardiovascular mortality,. Cardiovascular disease (CVD) remains the leading cause of death in MASLD, reflecting shared pathophysiological mechanisms such as insulin resistance, dyslipidaemia, pro‑coagulant states and hepatokine dysregulation,.
Current clinical practice guidelines from the European Association for the Study of the Liver, Diabetes and Obesity (EASL‑EASD‑EASO) recommend a stepwise, non‑invasive approach for case‑finding and fibrosis staging, employing blood‑based scores (e.g., FIB‑4) followed by imaging modalities such as transient elastography. Lifestyle modification—including weight loss, dietary changes, physical activity and alcohol restriction—remains the cornerstone of management, complemented by optimal control of metabolic comorbidities using agents such as GLP‑1 receptor agonists and SGLT2 inhibitors,. For patients with non‑cirrhotic MASH and significant fibrosis (stage ≥ 2), the thyroid‑hormone‑receptor‑β agonist resmetirom has demonstrated histological improvement in steatohepatitis and fibrosis, offering the first disease‑specific pharmacotherapy approved in the United States,. Nevertheless, no pharmacologic agent is presently recommended for cirrhotic MASLD, and management of advanced disease focuses on metabolic optimisation, surveillance for portal hypertension and HCC, and liver transplantation when indicated.
The re‑definition of MASLD also has implications for research and public health policy. Large‑scale population studies, such as the NHANES analysis, reveal that MASLD (including MetALD) affects roughly one‑third of the U.S. adult population, underscoring the need for coordinated screening strategies. Emerging data on metabolic reprogramming in hepatic stellate cells highlight novel therapeutic targets aimed at halting fibrogenesis. Together, these advances emphasize MASLD as a systemic metabolic disorder with substantial hepatic and extra‑hepatic morbidity, necessitating integrated, multidisciplinary approaches for prevention, early detection, and treatment.
Results
After extracting gene sets for MASLD from various resources including Enrichr, RummaGEO, Rummagene, Geneshot, MONDO, DO, GWAS Catalog and ClinVar, we try to identify those genes that are understudied for MASLD with fewer publications on PubMed.
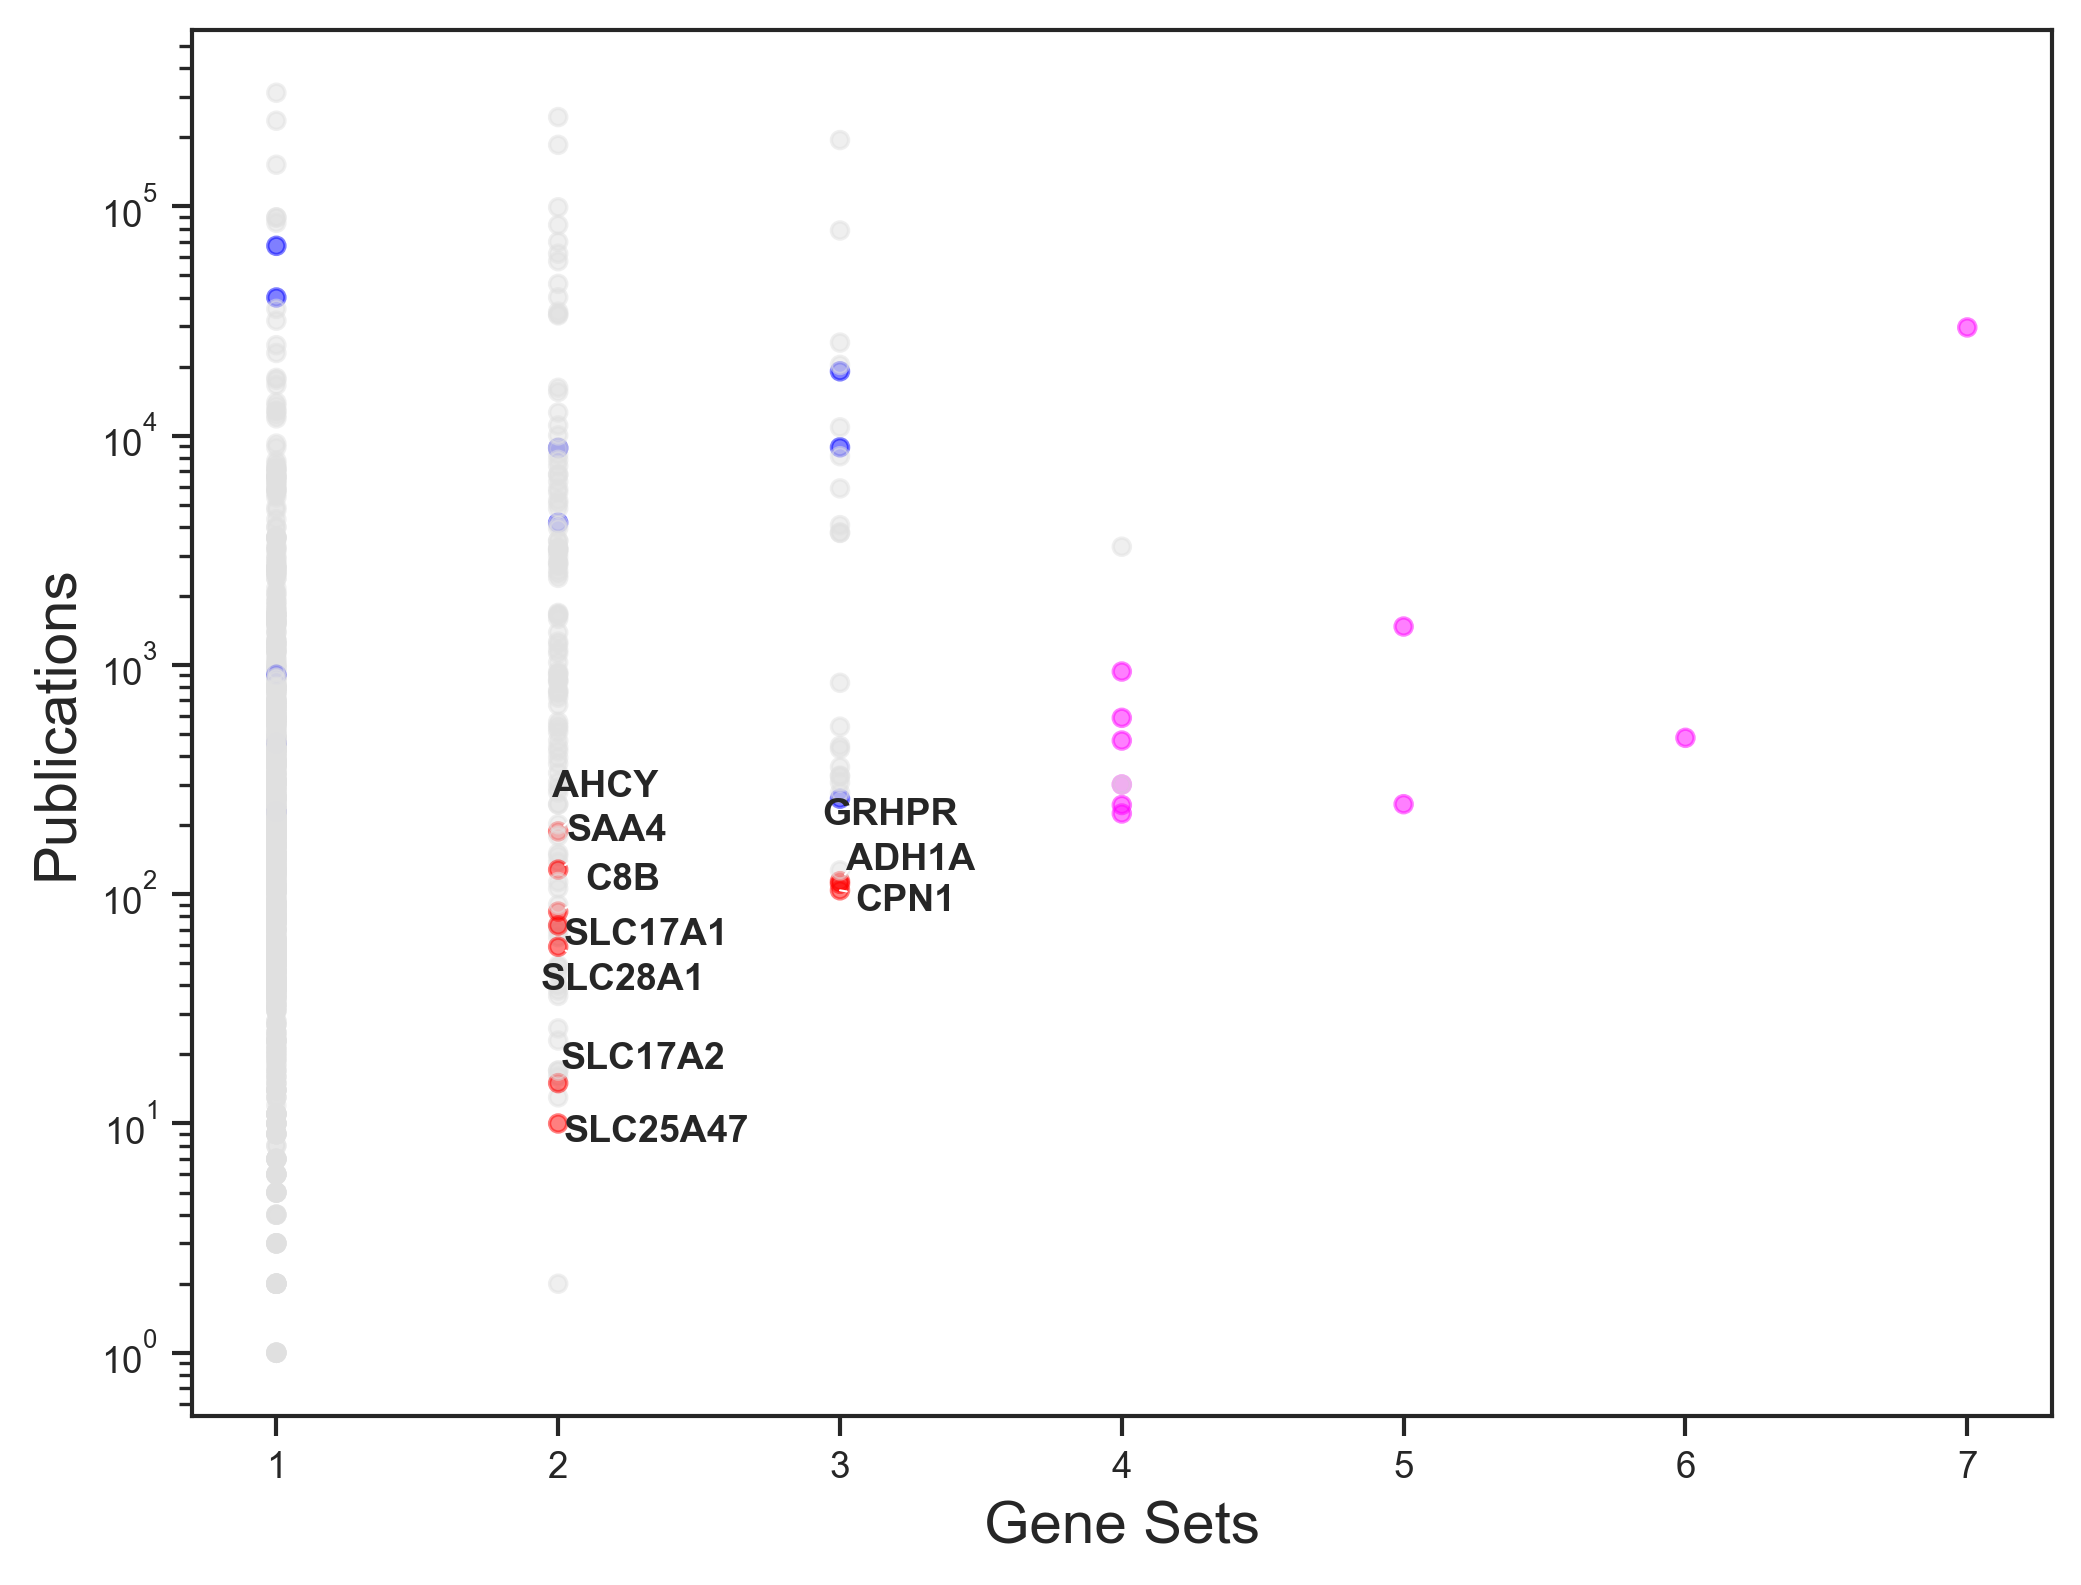
Figure: Scatterplot of publication counts vs gene set counts across all liver gene sets for each of the MASLD genes. Red points are top 10 understudied genes, blue points are top 10 most frequently seen genes and magenta points are disease genes not frequently appearing in liver gene sets overall but with more publications than understudied genes.
In figure 1, we plot publication counts and gene set counts for each MASLD gene using the counts across all liver disease gene sets. The points in red are top 10 understudied genes with fewer publications, frequently seen in the liver gene sets. Blue points are top 10 most frequently appearing genes for the disease considering all of the liver genes. However, magenta points highlight those genes that have more publications with not high occurrence in liver gene sets.
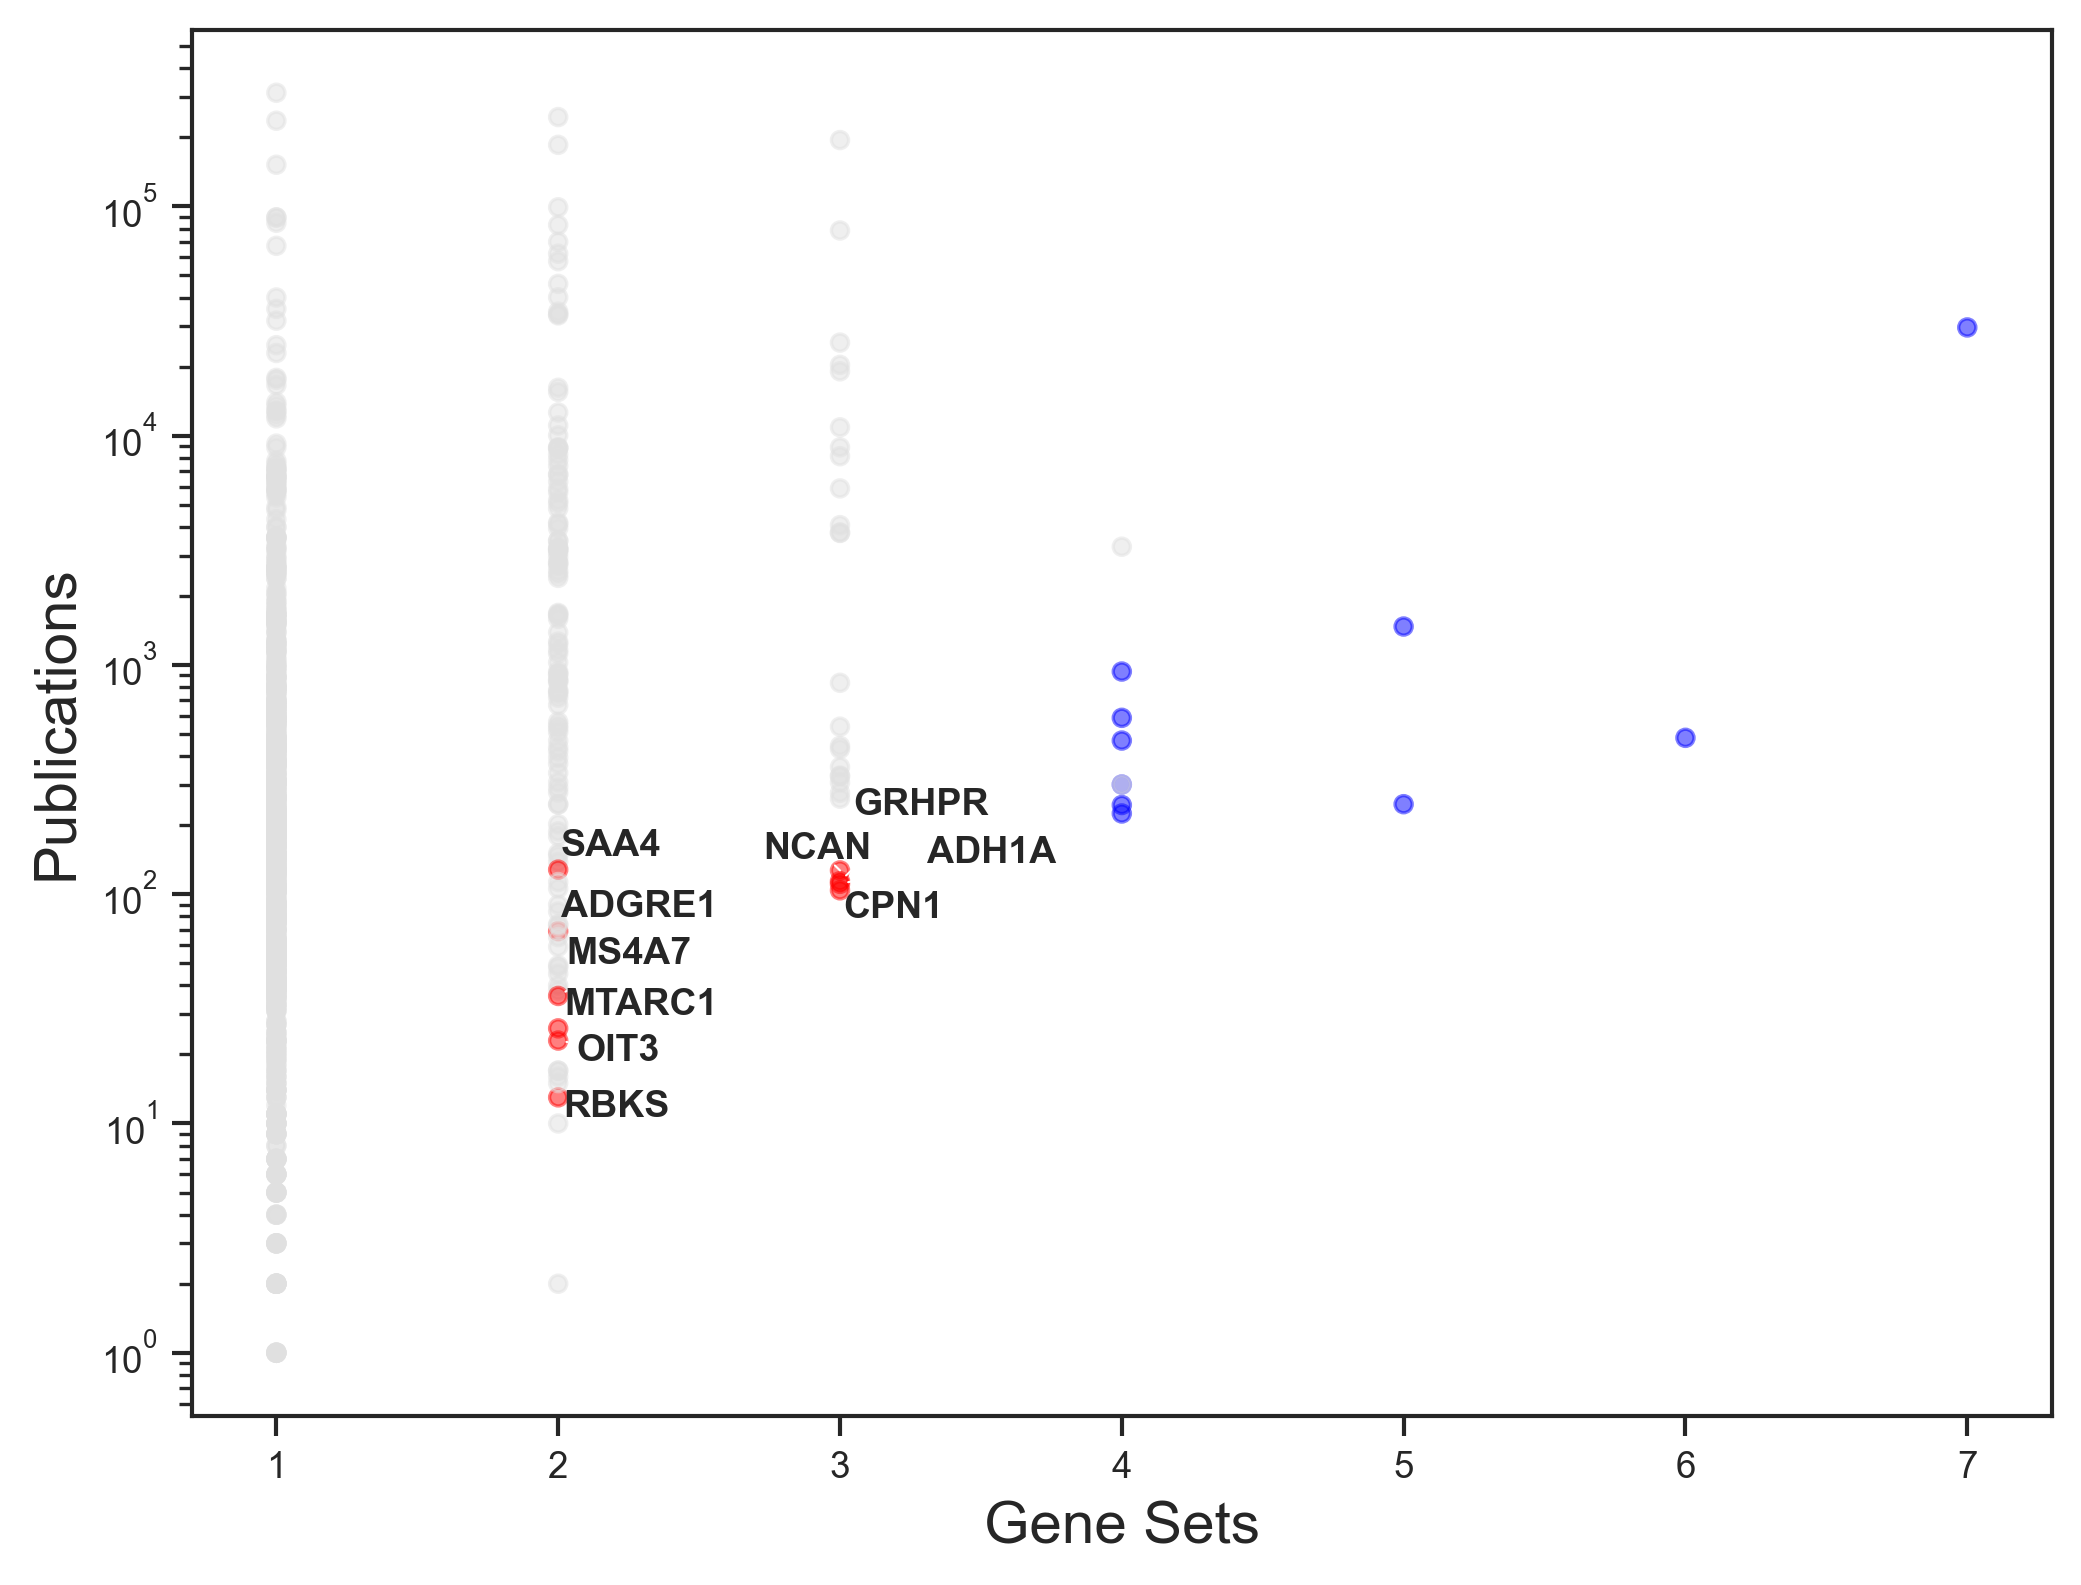
Figure: Scatterplot of publication counts vs gene set counts across only MASLD gene sets for each of the MASLD genes. Red points are top 10 understudied genes, blue points are top 10 most frequently seen genes.
In figure 2, we plot publication counts and gene set counts for each MASLD gene using only the MASLD disease gene sets. The points in red signify top 10 understudied genes with fewer publications and high frequency in MASLD gene sets, while the blue points are top 10 frequently appearing genes in the MASLD gene sets. The top 10 understudied genes for MASLD are - MTARC1, RBKS, NCAN, CPN1, GRHPR, ADGRE1, SAA4, OIT3, MS4A7 and ADH1A.
Another approach to get understudied genes for disease could be to use GSFM model to augment the disease genes for MASLD from MONDO resource and get unknown highly related genes for MASLD.
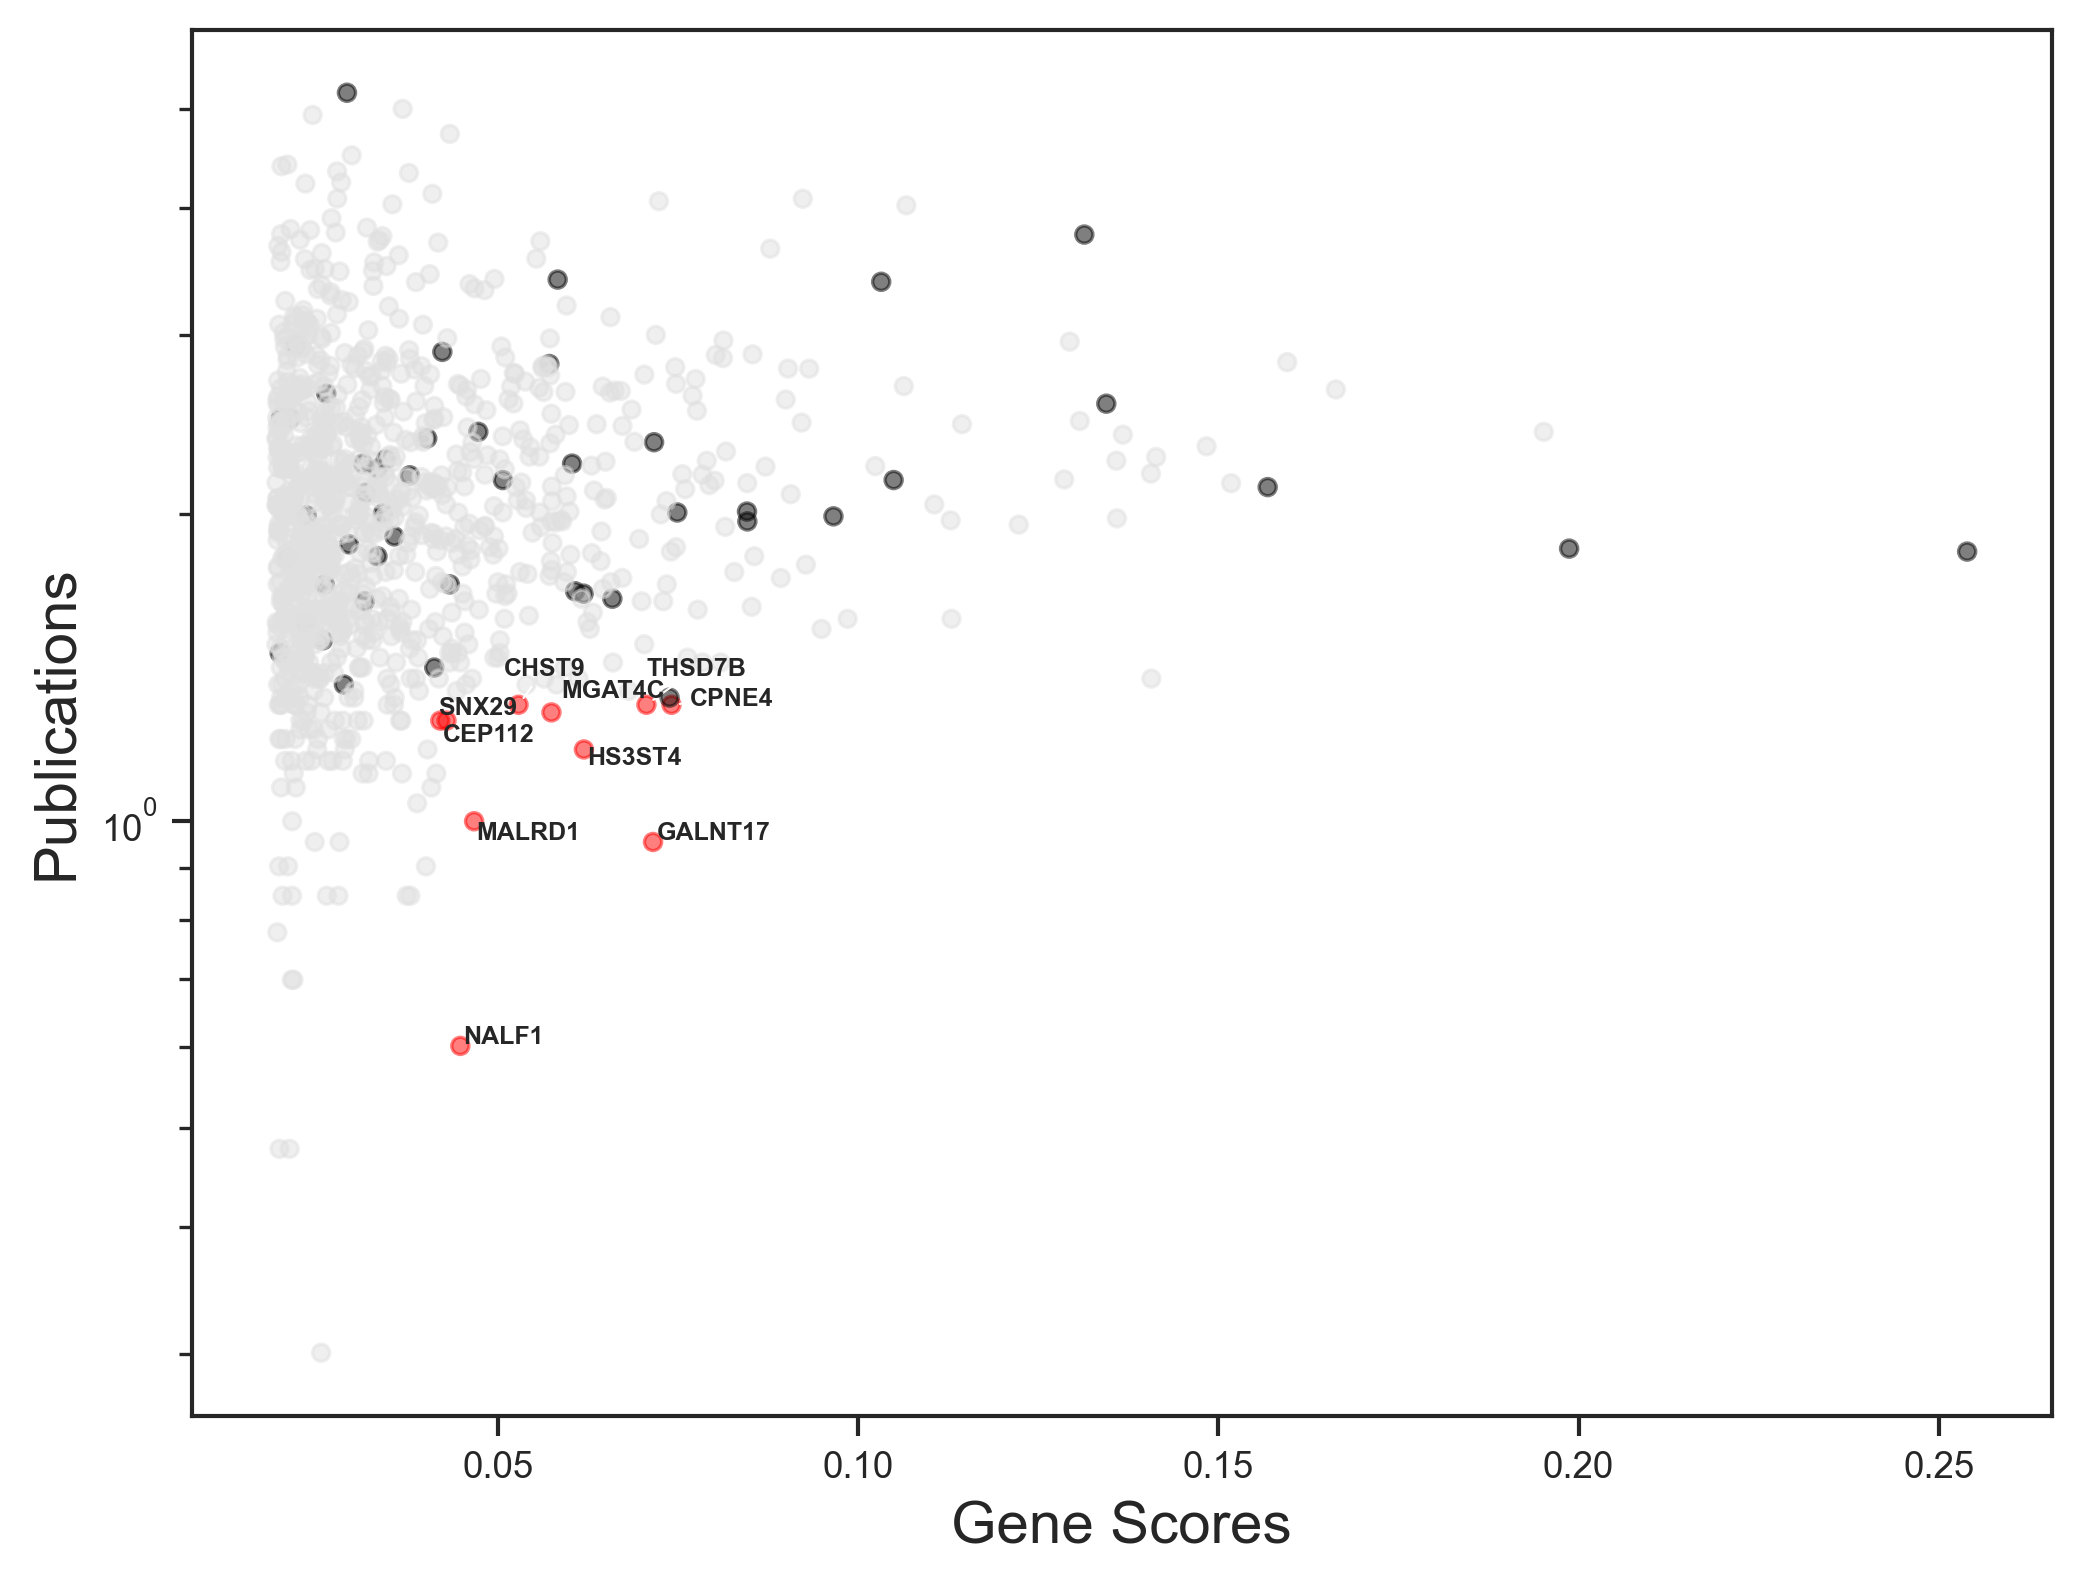
Figure: Scatterplot of publication counts vs GSFM gene scores for each of the predicted MASLD genes. Red points are top 10 understudied genes with high GSFM scores but fewer publications, blue points are top 10 genes with high GSFM scores.
In figure 3, we plot publication counts and GSFM gene scores for each of the predicted MASLD genes from GSFM by augmenting the MONDO disease genes for MASLD. The red points are top 10 genes with fewer publications and high GSFM scores that are not in the input MONDO MASLD genes, while the black points are top 10 genes that have high GSFM scores. The top 10 understudied genes with high GSFM scores not in the disease genes are - CPNE4, MALRD1, CHST9, CEP112, GALNT17, SNX29, MGAT4C, NALF1, THSD7B and HS3ST4.
These understudied genes identified might play a unexplored critical role in the pathology of MASLD that should be analyzed further through valid scientific RNA-seq experiments that knockout the genes in the healthy vs MASLD disease samples.
To understand the role these understudied genes play in MASLD pathology, we can find GEO studies where some of these genes are significantly up or down regulated for MASLD. Using RummaGEO, we can get these differentially expressed gene signatures related to MASLD. Details of the GEO studies for these signatures are listed in table 1.
Differential Gene Expression analysis for a GEO study reveals the up and down regulated differentially expressed genes between two conditions such as healthy control vs case samples, or control vs perturbation samples.
For MASLD GEO study GSE192959,GSE193084, raw counts data can be downloaded from NCBI FTP server or from ARCHS4 platform that contains uniformly processed counts data available for all human and mouse GEO studies. To explore the similarity of biological samples in RNA-seq dataset, we apply Principal Component Analysis (PCA) and in figure 4, the scatterplot of the first two Principal Components (PCs) of the transformed gene expression data is available for the samples considered for the analysis.
To perform DGE analysis, Limma-voom, technique is appiled to this raw counts data after clear case and control samples are identified for the study. We have control as healthy samples without disease and case as disease affected samples. Identify differentially expressed genes (DEGs) by P-value < 0.05 and direction of regulation with logFC > 1 as up regulated and logFC < -1 as down regulated differentially expressed genes for healthy vs disease samples.
In figure 5, a volcano plot shows the DEGs identified for GSE192959,GSE193084 study. Since this study contains samples of Healthy and chronic MASLD sample, we get the genes whose expression profiles have significantly changed in the MASLD disease compared to healthy samples.
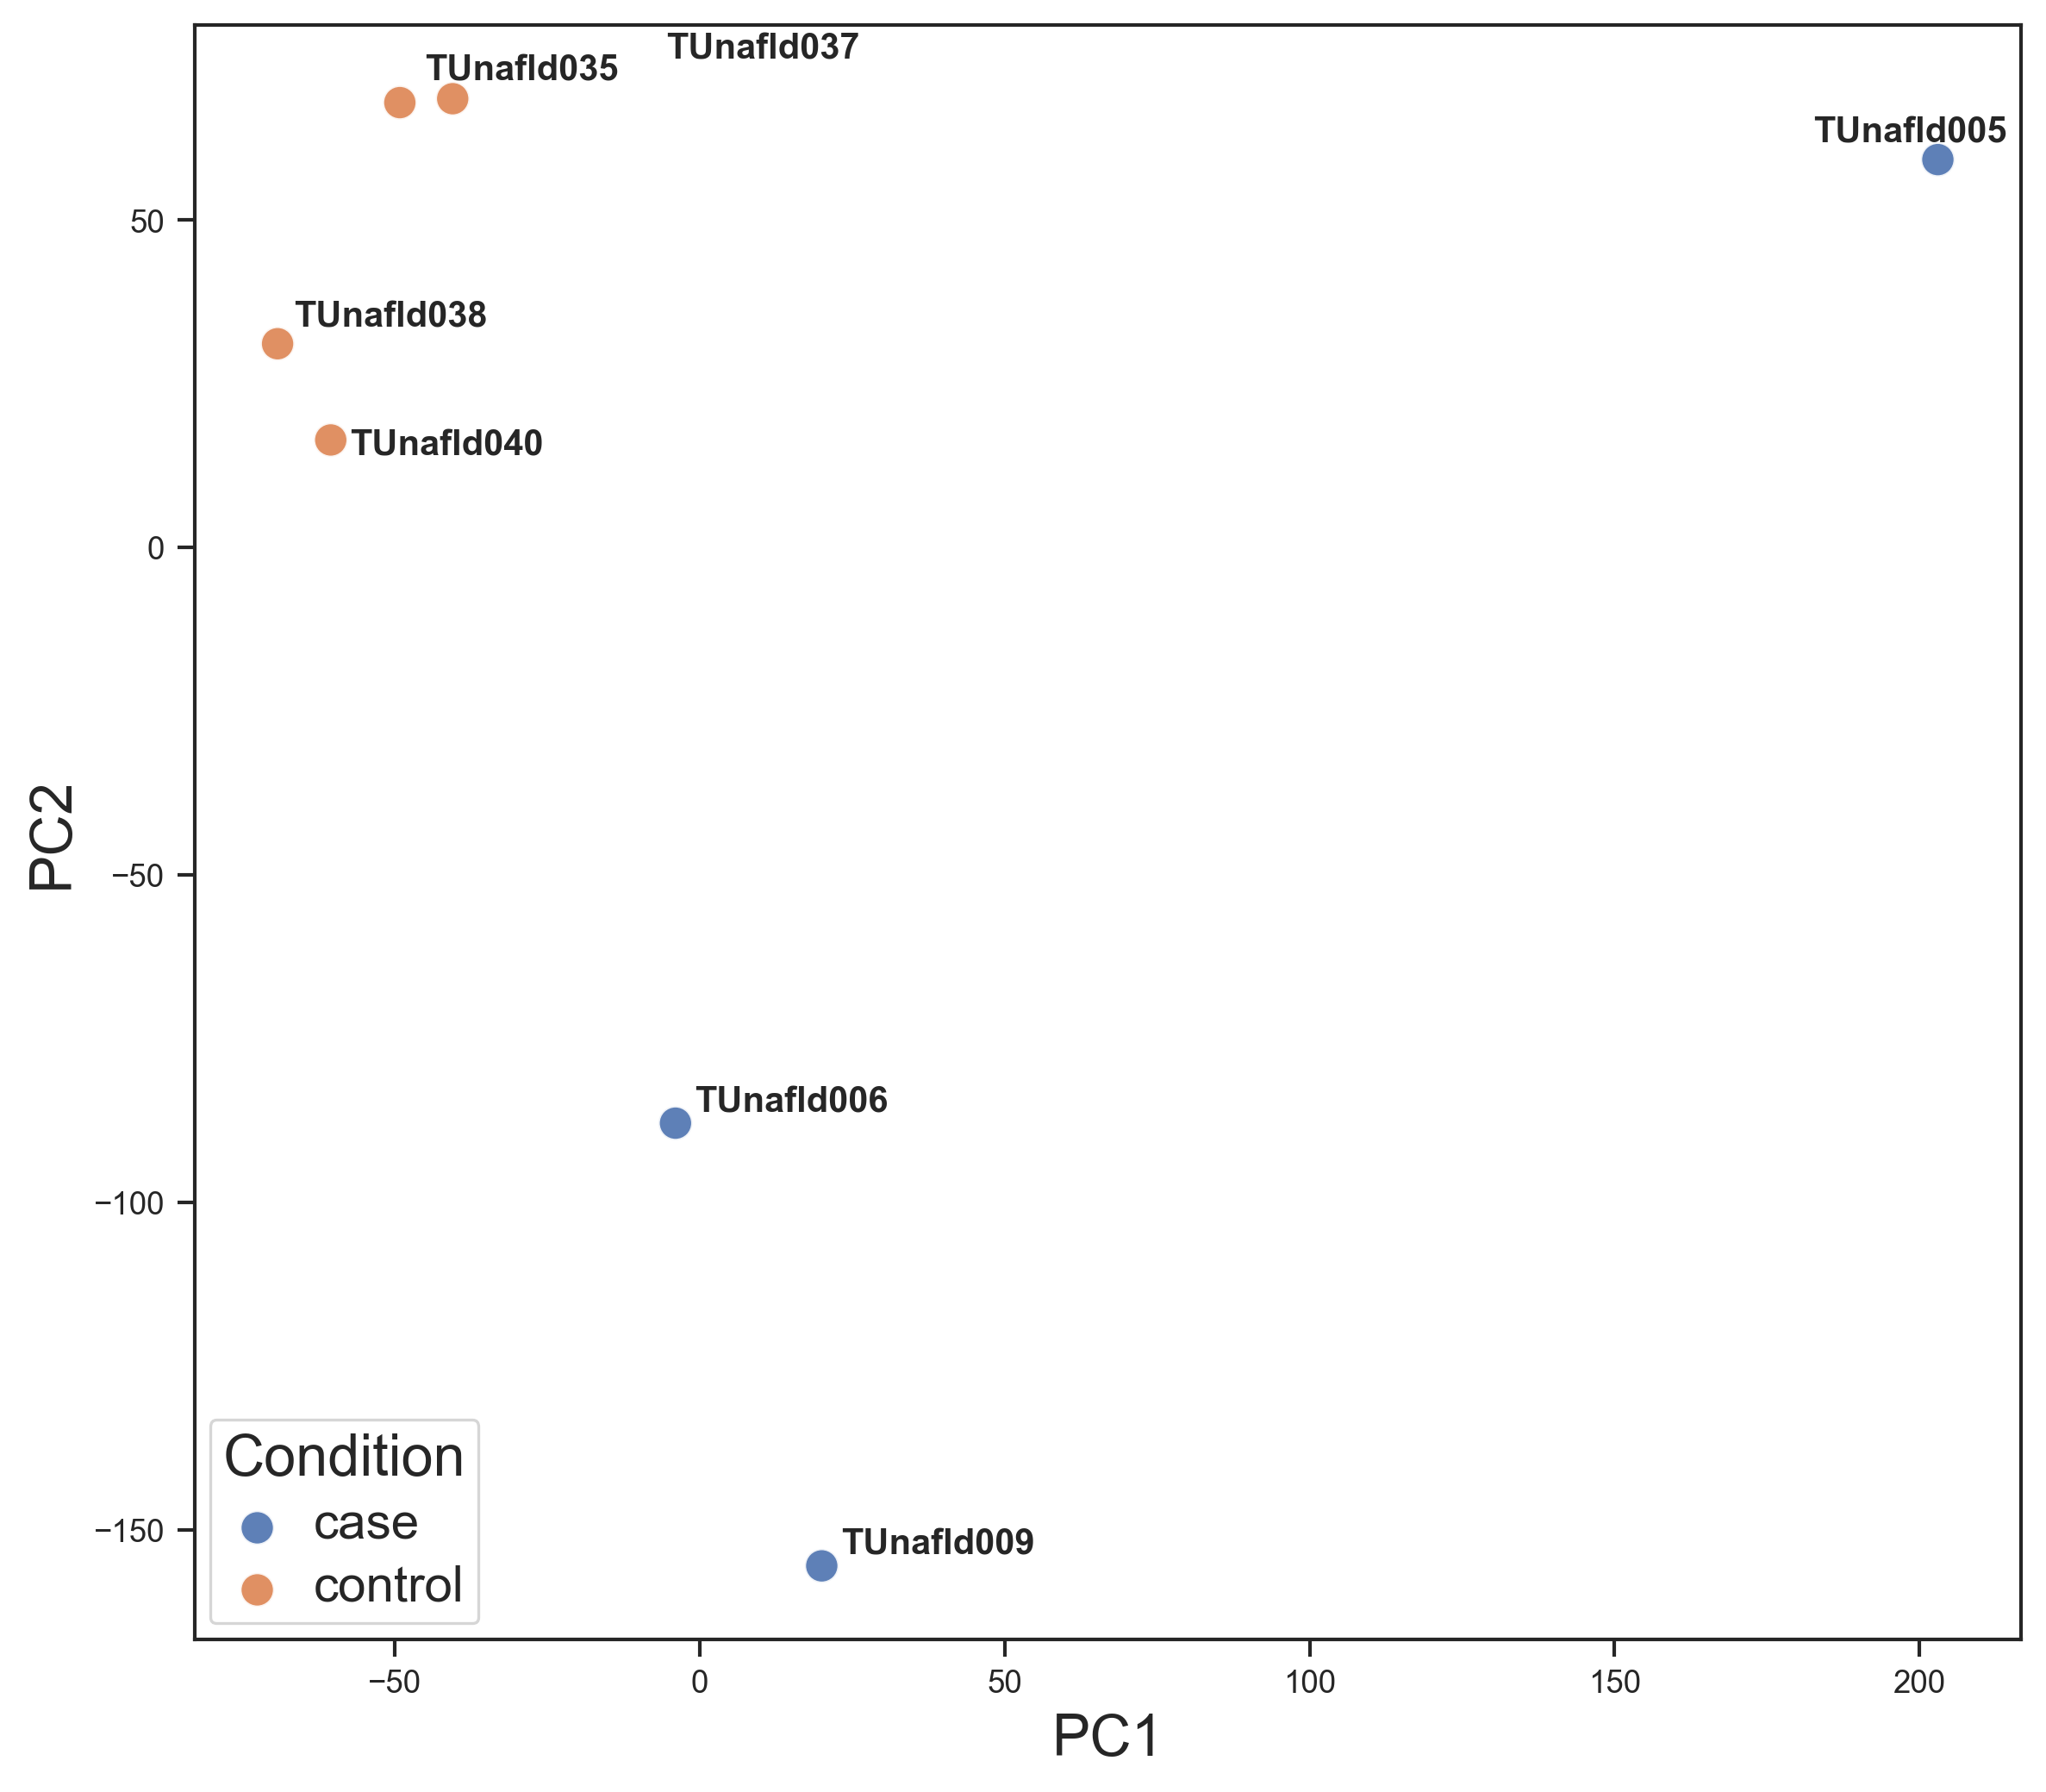
Figure: PCA plot of control and disease samples from the GEO study GSE192959,GSE193084. Blue points are control samples and orange points are disease samples. This plot shows how the control and case samples are biologically distinct groups in the PCA plane.
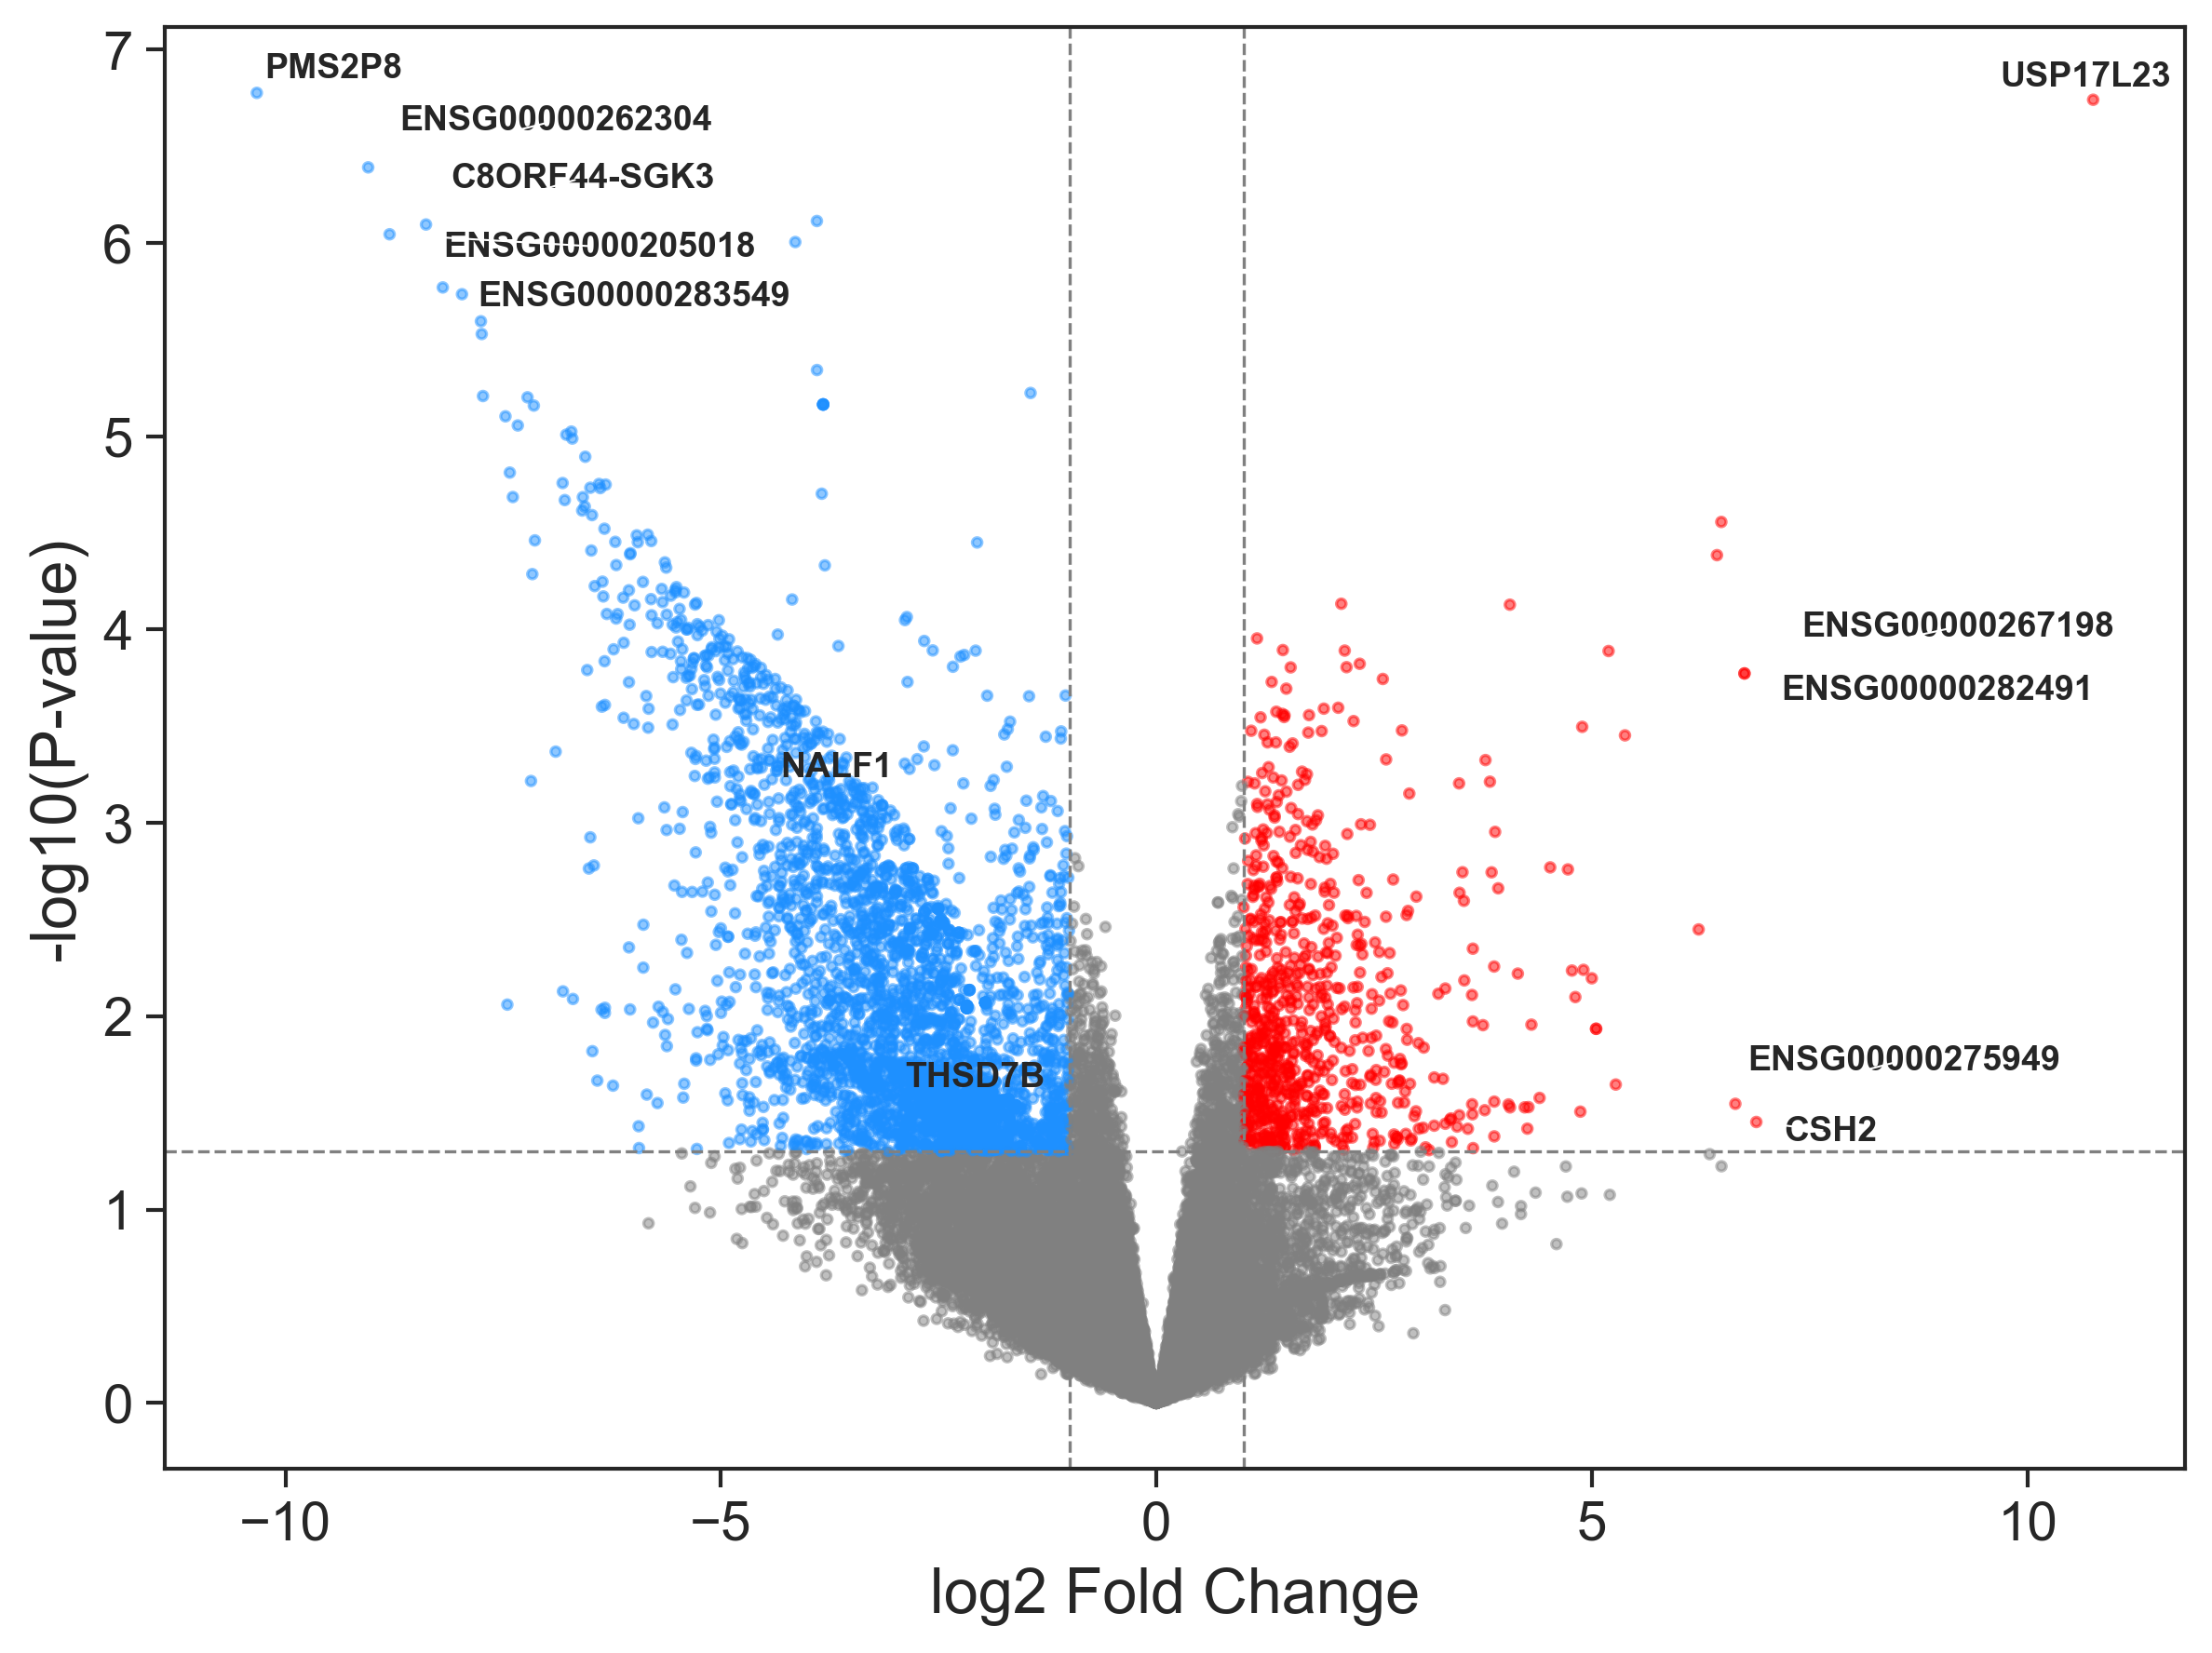
Figure: Volcano plot of P-value and LogFC on the limma-voom results for the GEO study for the Healthy Control vs MASLD samples.
Understudied genes {} NALF1, THSD7B are significantly down regulated in MASLD samples compared to healthy ones. While understudied genes {} {} are up regulated in MASLD samples compared to healthy samples.
For the list of up and down regulated genes we can then perform enrichment analysis using Enrichr API to get enriched terms with these DEGs as input queries as seen in figure 6 and figure 7.
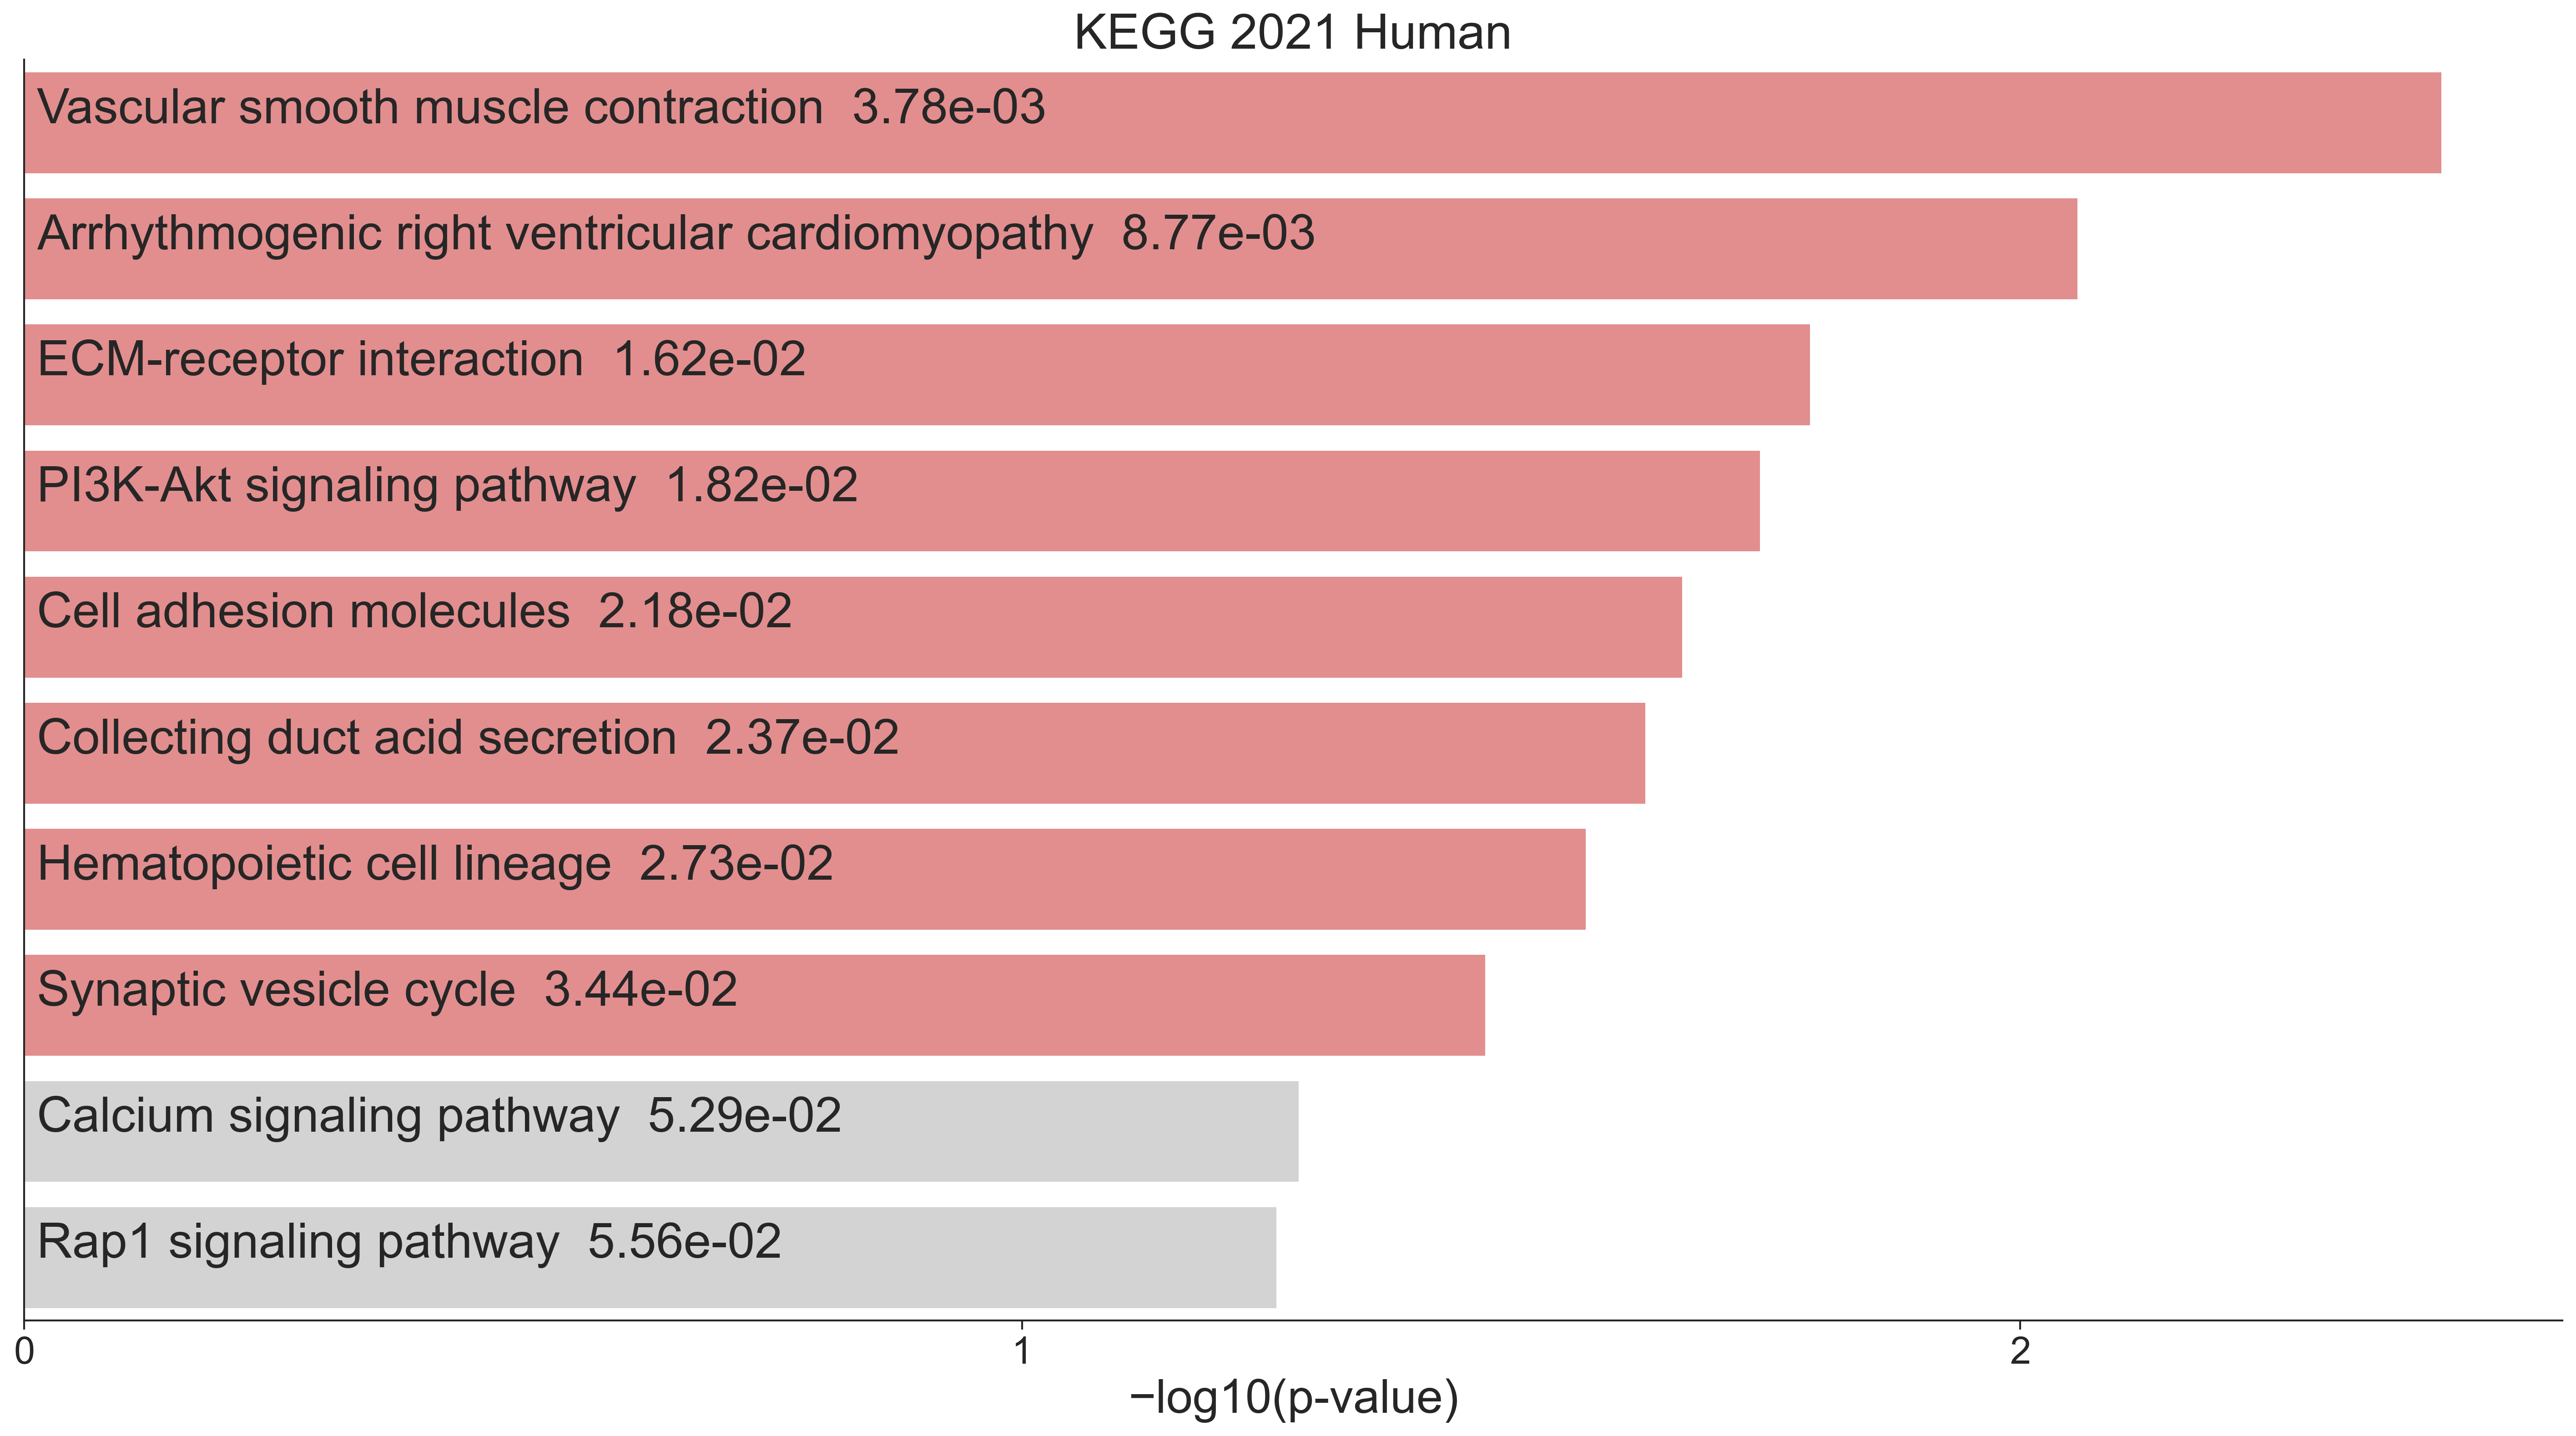
Figure: Bar chart of top enriched terms from the KEGG_2021 Human gene set library. The top 10 enriched terms for the input down gene set are displayed based on the -log10(p-value), with the actual p-value shown next to each term. The term at the top has the most significant overlap with the input down gene set in the case of Healthy Control vs MASLD_
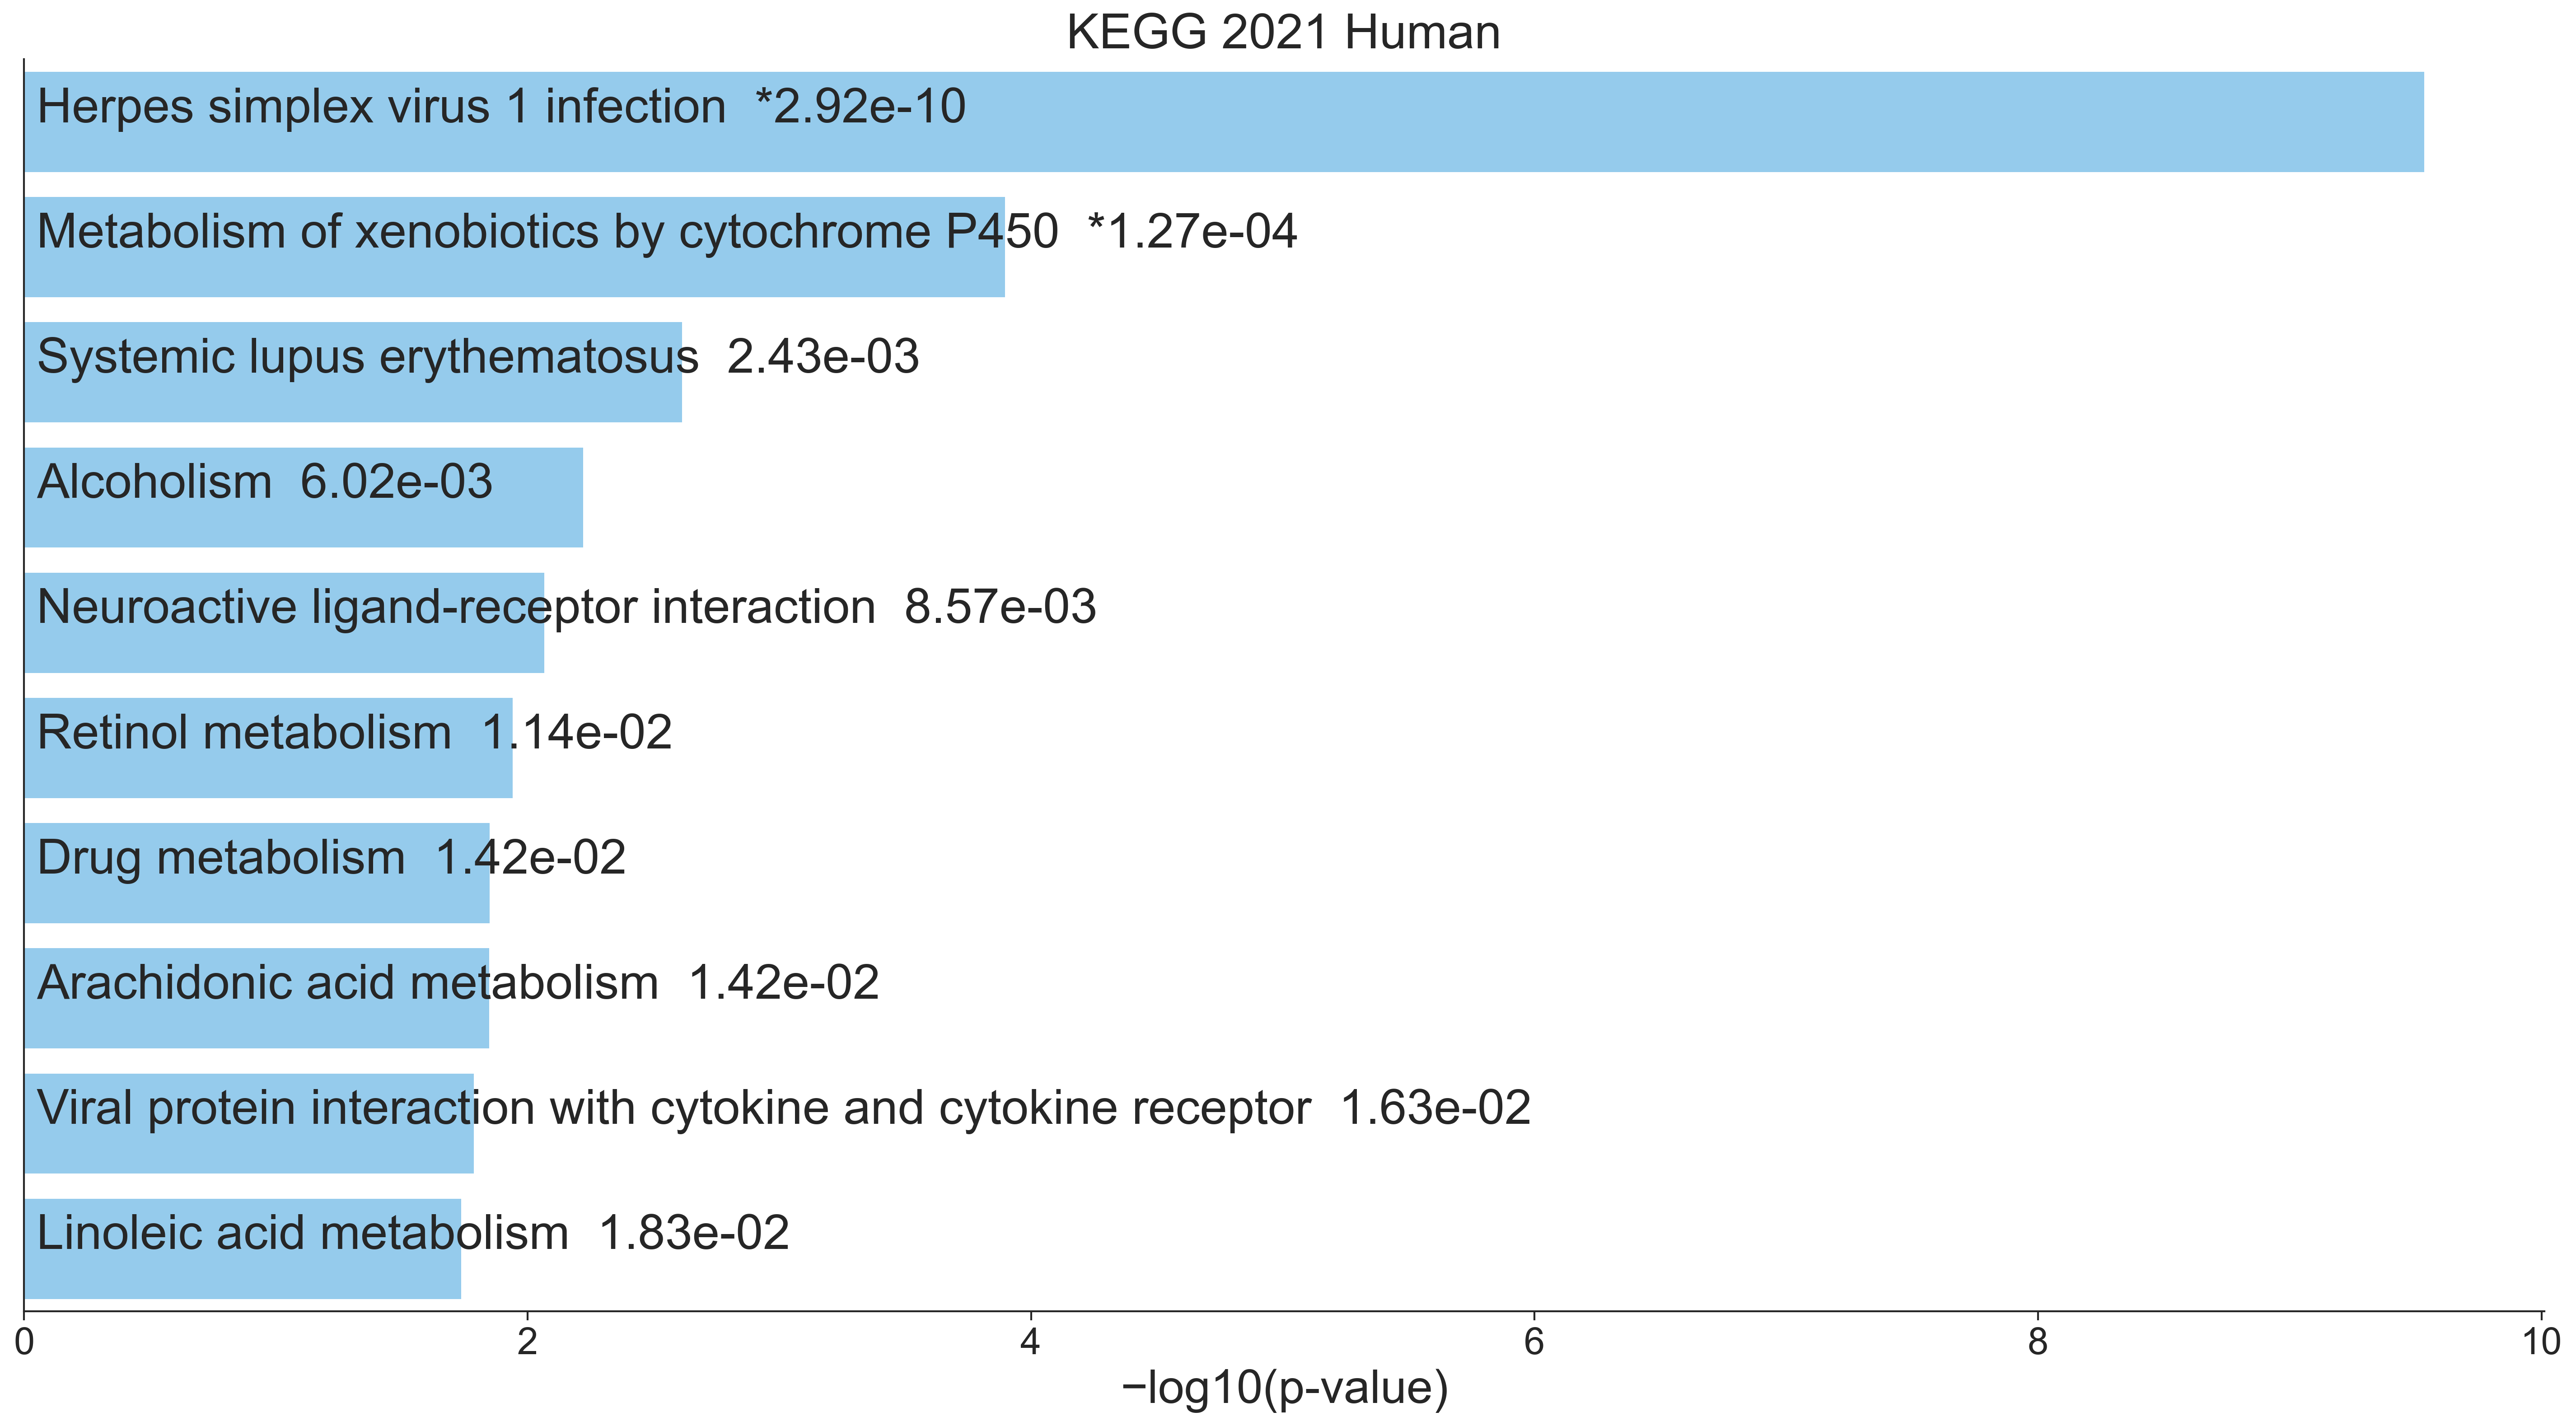
Figure: Bar chart of top enriched terms from the KEGG 2021_ Human gene set library. The top 10 enriched terms for the input up gene set are displayed based on the -log10(p-value), with the actual p-value shown next to each term. The term at the top has the most significant overlap with the input up gene set in the case of Healthy Control vs MASLD_
Using both the up and down genes, we can get drugs, perturbations from L2S2 associated with the gene signatures searched. Details of the drug predictions are available in table 2.
Figure: RummaGEO differential expression signatures for MASLD
Methods
Detailed introduction on the disease from DeepDive2.0
The introduction section for this article was generated from DeepDive2.0 for MASLD. First, the DeepDive workflow starts from the input disease term in this case "MASLD". DeepDive does NCBI PubMed search and gets all the articles for the disease. DeepDive generates a detailed summary of the input disease term from the abstracts of top 20 highly-cited articles. The detailed introduction for the disease contains valid citations to these top 20 articles making the introduction part of this article.
Potentially understudied genes from disease-associated genes
The gene sets for the MASLD disease was extracted from resources - Enrichr, RummaGEO, Rummagene, Geneshot, MONDO, DO, GWAS Catalog and ClinVar. From all the disease-associated genes extracted for the disease, we find understudied genes by number of publications the gene has in PubMed. Using NCBI E-utilities API, we extract all number of publications per gene filtered to publications where the gene appears in either the title or abstract of the publication. We create 2 scatter plots of publication counts vs frequency of the gene considering all liver diseases gene sets and considering just the MASLD disease gene sets. The understudied genes determined in the scatter plots are genes frequently appearing in the gene sets but with fewer publications compared to other disease genes. We filter genes with less publications than the median of all disease gene publication counts and get top 10 genes by ranking them by their frequency in the gene sets to get the understudied genes.
Understudied genes from GSFM
Another approach to get understudied genes for a disease is using Gene Set Foundational Model (GSFM), to augment the disease genes extracted for the disease from either MONDO or GWAS catalog resource. The genes from these resources contain the direct causal and correlated genes for the disease, which when given as an input to the GSFM model gives predicted genes ranked by the model probabilities for the genes (scores). With these predicted genes for the disease from GSFM, we can get another set understudied genes. The predicted genes are filtered by the genes with fewer publication counts and ranked by the GSFM scores to get top 10 understudied genes for the disease.
Differentially gene expression analysis of a GEO study
From the many GEO studies with up and down signatures for a disease term from RummaGEO, we pick the GEO whose signatures contain most understudied genes found for the disease. We then perform Differentially Gene Expression (DGE) analysis on the gene expression data for the study, GSE192959,GSE193084 for MASLD. We compute the significantly up and down regulated genes comparing healthy control to MASLD samples using Limma-voom, technique. Significantly expressed genes are determined by p-value < 0.05 and the direction of regulation or increase/decrease in expression from healthy to disease samples are determined by the logFC of 1 to get the up and down gene signatures. These up and down genes are given as separate inputs to Enrichr to fetch enrichment results for the input from KEGG 2021 library and these up and down signatures are given together as input for L2S2 up and down signature search to fetch drug predictions for these differentially expressed genes.
Discussion
The present study leveraged a multi‑source integrative pipeline to uncover genes that are recurrently implicated in metabolic dysfunction‑associated steatotic liver disease (MASLD) yet remain under‑explored in the biomedical literature. By intersecting disease‑associated gene sets derived from eight public repositories (Enrichr, RummaGEO, Rummagene, Geneshot, MONDO, DO, GWAS Catalog, and ClinVar) with PubMed publication counts, we identified two complementary cohorts of understudied candidates:
- Frequency‑driven understudied genes – genes that appear frequently across liver‑related gene sets but have fewer than median PubMed mentions. The top ten of this group (MTARC1, RBKS, NCAN, CPN1, GRHPR, ADGRE1, SAA4, OIT3, MS4A7, ADH1A) are already represented in MASLD‑related datasets, suggesting that they may play a substantive role in disease biology despite limited experimental scrutiny.
- Model‑driven understudied genes – genes predicted by the Gene Set Foundational Model (GSFM) to be highly associated with MASLD but lacking substantial publication records. The leading ten (CPNE4, MALRD1, CHST9, CEP112, GALNT17, SNX29, MGAT4C, NALF1, THSD7B, HS3ST4) were not part of the original MONDO disease gene list, indicating that they represent novel, hypothesis‑generating candidates.
Biological relevance of the identified genes
Several of the frequency‑driven genes have indirect links to metabolic pathways that are central to MASLD pathogenesis. For example, MTARC1 encodes a mitochondrial amidoxime‑reducing component that has been associated with hepatic lipid accumulation in genome‑wide association studies, yet functional validation remains scarce. NCAN (neurocan) is a proteoglycan implicated in extracellular matrix remodeling, a process that underlies hepatic fibrogenesis. ADH1A, a member of the alcohol dehydrogenase family, may intersect with the MetALD sub‑phenotype where moderate alcohol intake co‑exists with metabolic dysfunction.
The GSFM‑derived candidates introduce entirely new biological themes. CHST9 encodes a carbohydrate sulfotransferase, hinting at altered glycosaminoglycan sulfation in the hepatic microenvironment. SNX29 belongs to the sorting‑nexin family, suggesting potential dysregulation of endosomal trafficking and lipid droplet turnover. THSD7B and NALF1 were observed to be significantly down‑regulated in the MASLD GEO cohort (GSE192959/GSE193084), providing preliminary transcriptomic evidence that these genes respond to disease‑related stressors.
Integration with transcriptomic evidence
Differential expression analysis of the selected GEO dataset confirmed that a subset of the understudied genes (notably NALF1 and THSD7B) are down‑regulated in MASLD liver biopsies relative to healthy controls. Enrichment of the down‑regulated signature in KEGG pathways related to lipid metabolism, oxidative phosphorylation, and extracellular matrix organization aligns with known MASLD mechanisms, reinforcing the plausibility that these genes contribute to disease phenotypes.
Conversely, several of the frequency‑driven genes (e.g., MTARC1, NCAN) were not among the most differentially expressed in this particular dataset, suggesting that their functional impact may be context‑dependent (e.g., stage‑specific, cell‑type specific, or mediated through post‑transcriptional regulation). This underscores the importance of complementary experimental approaches—such as proteomics, single‑cell RNA‑seq, and functional genomics—to capture the full spectrum of gene activity.
Potential therapeutic implications
The identification of understudied genes opens avenues for novel therapeutic target discovery. Genes that are both highly connected within MASLD‑related networks and minimally investigated represent low‑competition opportunities for drug development. For instance, targeting the enzymatic activity of CHST9 could modulate sulfation patterns that influence hepatic stellate cell activation, a key driver of fibrosis. Similarly, modulating SNX29‑mediated vesicular trafficking might affect lipid droplet turnover and ameliorate steatosis.
Drug‑repositioning analyses using the up‑ and down‑regulated signatures (via L2S2) yielded candidate compounds that merit further validation. While these predictions are preliminary, they provide a testable framework for assessing whether modulation of the newly identified genes can recapitulate the beneficial transcriptional shifts observed with known anti‑MASLD agents (e.g., GLP‑1R agonists, resmetirom).
Limitations
Several methodological constraints should be acknowledged. First, the reliance on PubMed publication counts as a proxy for “study depth” may bias against genes that are well‑characterized in non‑human models or in fields outside hepatology. Second, the gene sets extracted from public databases are heterogeneous in curation quality and may contain false positives or omissions. Third, the GSFM model, while powerful, is trained on existing knowledge bases; its predictions may reflect latent biases in the training data. Finally, the transcriptomic validation was limited to a single GEO cohort; broader validation across independent MASLD cohorts, including diverse ethnicities and disease stages, is required to generalize the findings.
Future directions
To translate these computational insights into biological understanding, the following steps are recommended:
- Experimental validation: CRISPR‑mediated knockout or overexpression of top understudied genes in hepatic cell lines, organoids, and mouse models of MASLD to assess effects on lipid accumulation, inflammation, and fibrosis.
- Single‑cell resolution: Integrate single‑cell RNA‑seq and spatial transcriptomics data from MASLD liver biopsies to pinpoint the cellular contexts (hepatocytes, stellate cells, immune subsets) where these genes are active.
- Proteomic and metabolomic profiling: Determine whether transcriptional changes translate into altered protein abundance or metabolic fluxes, particularly for enzymes such as MTARC1 and CHST9.
- Clinical correlation: Correlate expression levels of candidate genes with histological severity, serum biomarkers, and clinical outcomes in well‑phenotyped patient cohorts.
- Therapeutic screening: Employ high‑throughput small‑molecule libraries to identify modulators of the understudied targets, followed by in‑vivo efficacy testing in preclinical MASLD models.
Conclusion
By systematically integrating disease‑associated gene repositories, literature mining, and machine‑learning‑based gene prediction, we have highlighted a set of understudied genes that are plausibly involved in MASLD pathogenesis. The convergence of computational prioritization with preliminary transcriptomic evidence supports the notion that these genes represent fertile ground for mechanistic studies and therapeutic innovation. Continued interdisciplinary efforts—combining bioinformatics, experimental hepatology, and clinical investigation—will be essential to elucidate the roles of these candidates and to ultimately improve outcomes for patients with MASLD.
Acknowledgements
This manuscript used assistance from the Ollama GPT ‑OSS:120b large language model and DeepDive2.0 resource.
References
-
Rinella (2023) A multisociety Delphi consensus statement on new fatty liver disease nomenclature. J Hepatol. DOI: 10.1016/j.jhep.2023.06.003 ↩ ↩2
-
Younossi (2025) Epidemiology of metabolic dysfunction-associated steatotic liver disease. Clin Mol Hepatol. DOI: 10.3350/cmh.2024.0431 ↩
-
Miao (2024) Current status and future trends of the global burden of MASLD. Trends Endocrinol Metab. DOI: 10.1016/j.tem.2024.02.007 ↩
-
European Association for the Study of the Liver (2024) EASL-EASD-EASO Clinical Practice Guidelines on the management of metabolic dysfunction-associated steatotic liver disease (MASLD). J Hepatol. DOI: 10.1016/j.jhep.2024.04.031 ↩ ↩2 ↩3 ↩4 ↩5
-
Hagström (2024) Natural history and progression of metabolic dysfunction-associated steatotic liver disease. Lancet Gastroenterol Hepatol. DOI: 10.1016/S2468-1253(24)00193-6 ↩
-
Targher (2024) MASLD: a systemic metabolic disorder with cardiovascular and malignant complications. Gut. DOI: 10.1136/gutjnl-2023-330595 ↩ ↩2
-
Lee (2024) Metabolic dysfunction-associated steatotic liver disease and risk of cardiovascular disease. Gut. DOI: 10.1136/gutjnl-2023-331003 ↩
-
Stefan (2025) Metabolic dysfunction-associated steatotic liver disease: heterogeneous pathomechanisms and effectiveness of metabolism-based treatment. Lancet Diabetes Endocrinol. DOI: 10.1016/S2213-8587(24)00318-8 ↩
-
Chan (2023) Metabolic Dysfunction-Associated Steatotic Liver Disease (MASLD): A State-of-the-Art Review. J Obes Metab Syndr. DOI: 10.7570/jomes23052 ↩
-
Harrison (2024) A Phase 3, Randomized, Controlled Trial of Resmetirom in NASH with Liver Fibrosis. N Engl J Med. DOI: 10.1056/NEJMoa2309000 ↩
-
Kalligeros (2024) Prevalence of Steatotic Liver Disease (MASLD, MetALD, and ALD) in the United States: NHANES 2017-2020. Clin Gastroenterol Hepatol. DOI: 10.1016/j.cgh.2023.11.003 ↩
-
Horn (2024) Metabolic reprogramming in liver fibrosis. Cell Metab. DOI: 10.1016/j.cmet.2024.05.003 ↩
-
Lachmann (2018) Massive mining of publicly available RNA-seq data from human and mouse. Nature Communications. DOI: 10.1038/s41467-018-03751-6 ↩
-
Law (2014) voom: precision weights unlock linear model analysis tools for RNA-seq read counts. Genome Biology. DOI: 10.1186/gb-2014-15-2-r29 ↩ ↩2
-
Ritchie (2015) limma powers differential expression analyses for RNA-sequencing and microarray studies. Nucleic Acids Research. DOI: 10.1093/nar/gkv007 ↩ ↩2
-
Xie (2021) Gene Set Knowledge Discovery with Enrichr. Current Protocols. DOI: 10.1002/cpz1.90 ↩ ↩2 ↩3
-
Marino (2025) L2S2: chemical perturbation and CRISPR KO LINCS L1000 signature search engine. Nucleic Acids Research. DOI: 10.1093/nar/gkaf373 ↩ ↩2
-
Marino (2025) L2S2: chemical perturbation and CRISPR KO LINCS L1000 signature search engine. Nucleic Acids Research. DOI: doi:10.1093/nar/gkaf373 ↩ ↩2
-
Clarke (2024) Rummagene: massive mining of gene sets from supporting materials of biomedical research publications. Communications Biology. DOI: 10.1038/s42003-024-06177-7 ↩
-
Lachmann (2019) Geneshot: search engine for ranking genes from arbitrary text queries. Nucleic Acids Research. DOI: 10.1093/nar/gkz393 ↩
-
Vasilevsky (2025) Mondo: Integrating Disease Terminology Across Communities. Genetics. DOI: 10.1093/genetics/iyaf215 ↩ ↩2
-
Schriml (2022) The Human Disease Ontology 2022 update. Nucleic Acids Research. DOI: 0.1093/nar/gkab1063 ↩
-
Buniello (2019) The NHGRI-EBI GWAS Catalog of published genome-wide association studies, targeted arrays and summary statistics. Nucleic Acids Research. DOI: 10.1093/nar/gky1120 ↩ ↩2
-
L (2014) ClinVar: public archive of relationships among sequence variation and human phenotype. Nucleic Acids Research. DOI: 10.1093/nar/gkt1113 ↩
-
Clarke (2025) A Gene Set Foundation Model Pre-Trained on a Massive Collection of Diverse Gene Sets. Preprint on bioRxiv. DOI: 10.1101/2025.05.30.657124 ↩
Peer review
No reviews yet.
History
Sign in to comment.