Under-studied Genes Likely Associated with MASH
›Details · v1 · 2 subjects · 1 attachment
Abstract
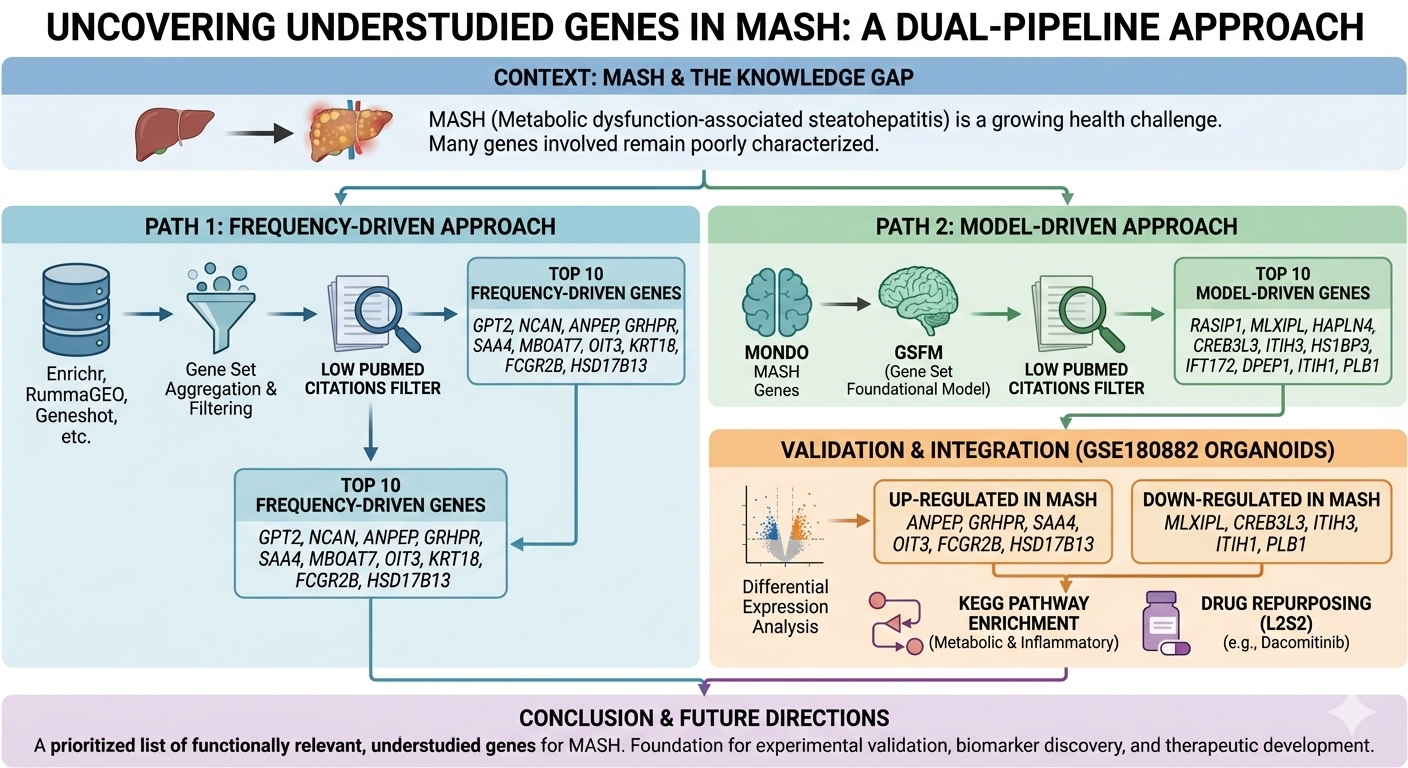
Metabolic dysfunction‑associated steatohepatitis (MASH) remains a major clinical challenge, yet many genes that may contribute to its pathogenesis are poorly characterized. To systematically uncover such understudied candidates, we aggregated MASH‑related gene sets from eight curated resources (Enrichr, RummaGEO, Rummagene, Geneshot, MONDO, DO, GWAS Catalog, ClinVar) and ranked genes by their frequency of appearance versus PubMed citation counts, identifying ten “frequency‑driven” understudied genes (GPT2, NCAN, ANPEP, GRHPR, SAA4, MBOAT7, OIT3, KRT18, FCGR2B, HSD17B13). In parallel, we employed the Gene Set Foundational Model (GSFM) to predict disease‑relevant genes from MONDO‑derived seed sets, extracting a second panel of ten high‑scoring yet sparsely published genes (RASIP1, MLXIPL, HAPLN4, CREB3L3, ITIH3, HS1BP3, IFT172, DPEP1, ITIH1, PLB1). Orthogonal validation using differential expression analysis of the GEO dataset GSE180882 (healthy versus MASH organoids) revealed that several frequency‑driven genes (e.g., ANPEP, GRHPR, SAA4, OIT3, FCGR2B, HSD17B13) are up‑regulated, while a subset of model‑driven genes (e.g., MLXIPL, CREB3L3, ITIH3, ITIH1, PLB1) are down‑regulated in MASH samples. Enrichment of the resulting up‑ and down‑regulated signatures highlighted metabolic and inflammatory KEGG pathways, and drug‑perturbation mining via L2S2 nominated compounds such as dacomitinib that inversely mimic the disease signature. Together, these data-driven pipelines prioritize a set of understudied genes that are plausibly involved in MASH biology and provide a foundation for future functional and therapeutic investigations.
Introduction
Metabolic dysfunction‑associated steatotic liver disease (MASLD) has rapidly supplanted the historic term non‑alcoholic fatty liver disease (NAFLD) as the preferred nomenclature for a spectrum of liver disorders driven by cardiometabolic risk factors. Within this spectrum, metabolic dysfunction‑associated steatohepatitis (MASH) denotes the inflammatory, fibrotic stage that parallels the former entity non‑alcoholic steatohepatitis (NASH). Epidemiological surveys estimate that up to 38 % of adults worldwide meet MASLD criteria, and the prevalence of MASH is rising in parallel with the global obesity and type‑2‑diabetes epidemics. The re‑definition of the disease aims to reduce stigma associated with the “non‑alcoholic” label and to emphasize the central role of metabolic dysfunction in disease pathogenesis.
The clinical relevance of MASH stems from its propensity to progress to advanced fibrosis, cirrhosis, and hepatocellular carcinoma (HCC). Recent practice guidelines highlight a stepwise diagnostic algorithm that combines non‑invasive serum scores (e.g., FIB‑4) with imaging modalities such as transient elastography to identify patients with significant fibrosis who may benefit from targeted therapy. Importantly, the guidelines endorse lifestyle modification as the cornerstone of management and endorse the use of incretin‑based agents (e.g., semaglutide, tirzepatide) for patients with concomitant type‑2 diabetes or obesity,. The phase‑III trial of tirzepatide demonstrated promising efficacy in reducing steatohepatitis activity and fibrosis, positioning it as a leading candidate for MASH‑directed pharmacotherapy.
Despite these advances, several knowledge gaps persist. The heterogeneity of MASLD/MASH across ethnicities, sexes, and age groups remains incompletely characterized, and the molecular mechanisms linking metabolic dysfunction to hepatic inflammation are only partially understood. Moreover, the lack of universally accepted histological endpoints and the limited availability of long‑term outcome data hinder the development of robust therapeutic endpoints. Consequently, there is a pressing need for large‑scale, multi‑omics investigations that can delineate the regulatory networks driving disease progression and identify novel biomarkers for early detection and treatment response.
In this article we review the current state of knowledge on MASH, summarizing epidemiology, diagnostic criteria, therapeutic options, and outstanding research challenges. By integrating recent clinical guidelines with emerging translational data, we aim to provide a comprehensive framework to guide future investigations and improve patient care.
Results
After extracting gene sets for MASH from various resources including Enrichr, RummaGEO, Rummagene, Geneshot, MONDO, DO, GWAS Catalog and ClinVar, we try to identify those genes that are understudied for MASH with fewer publications on PubMed.
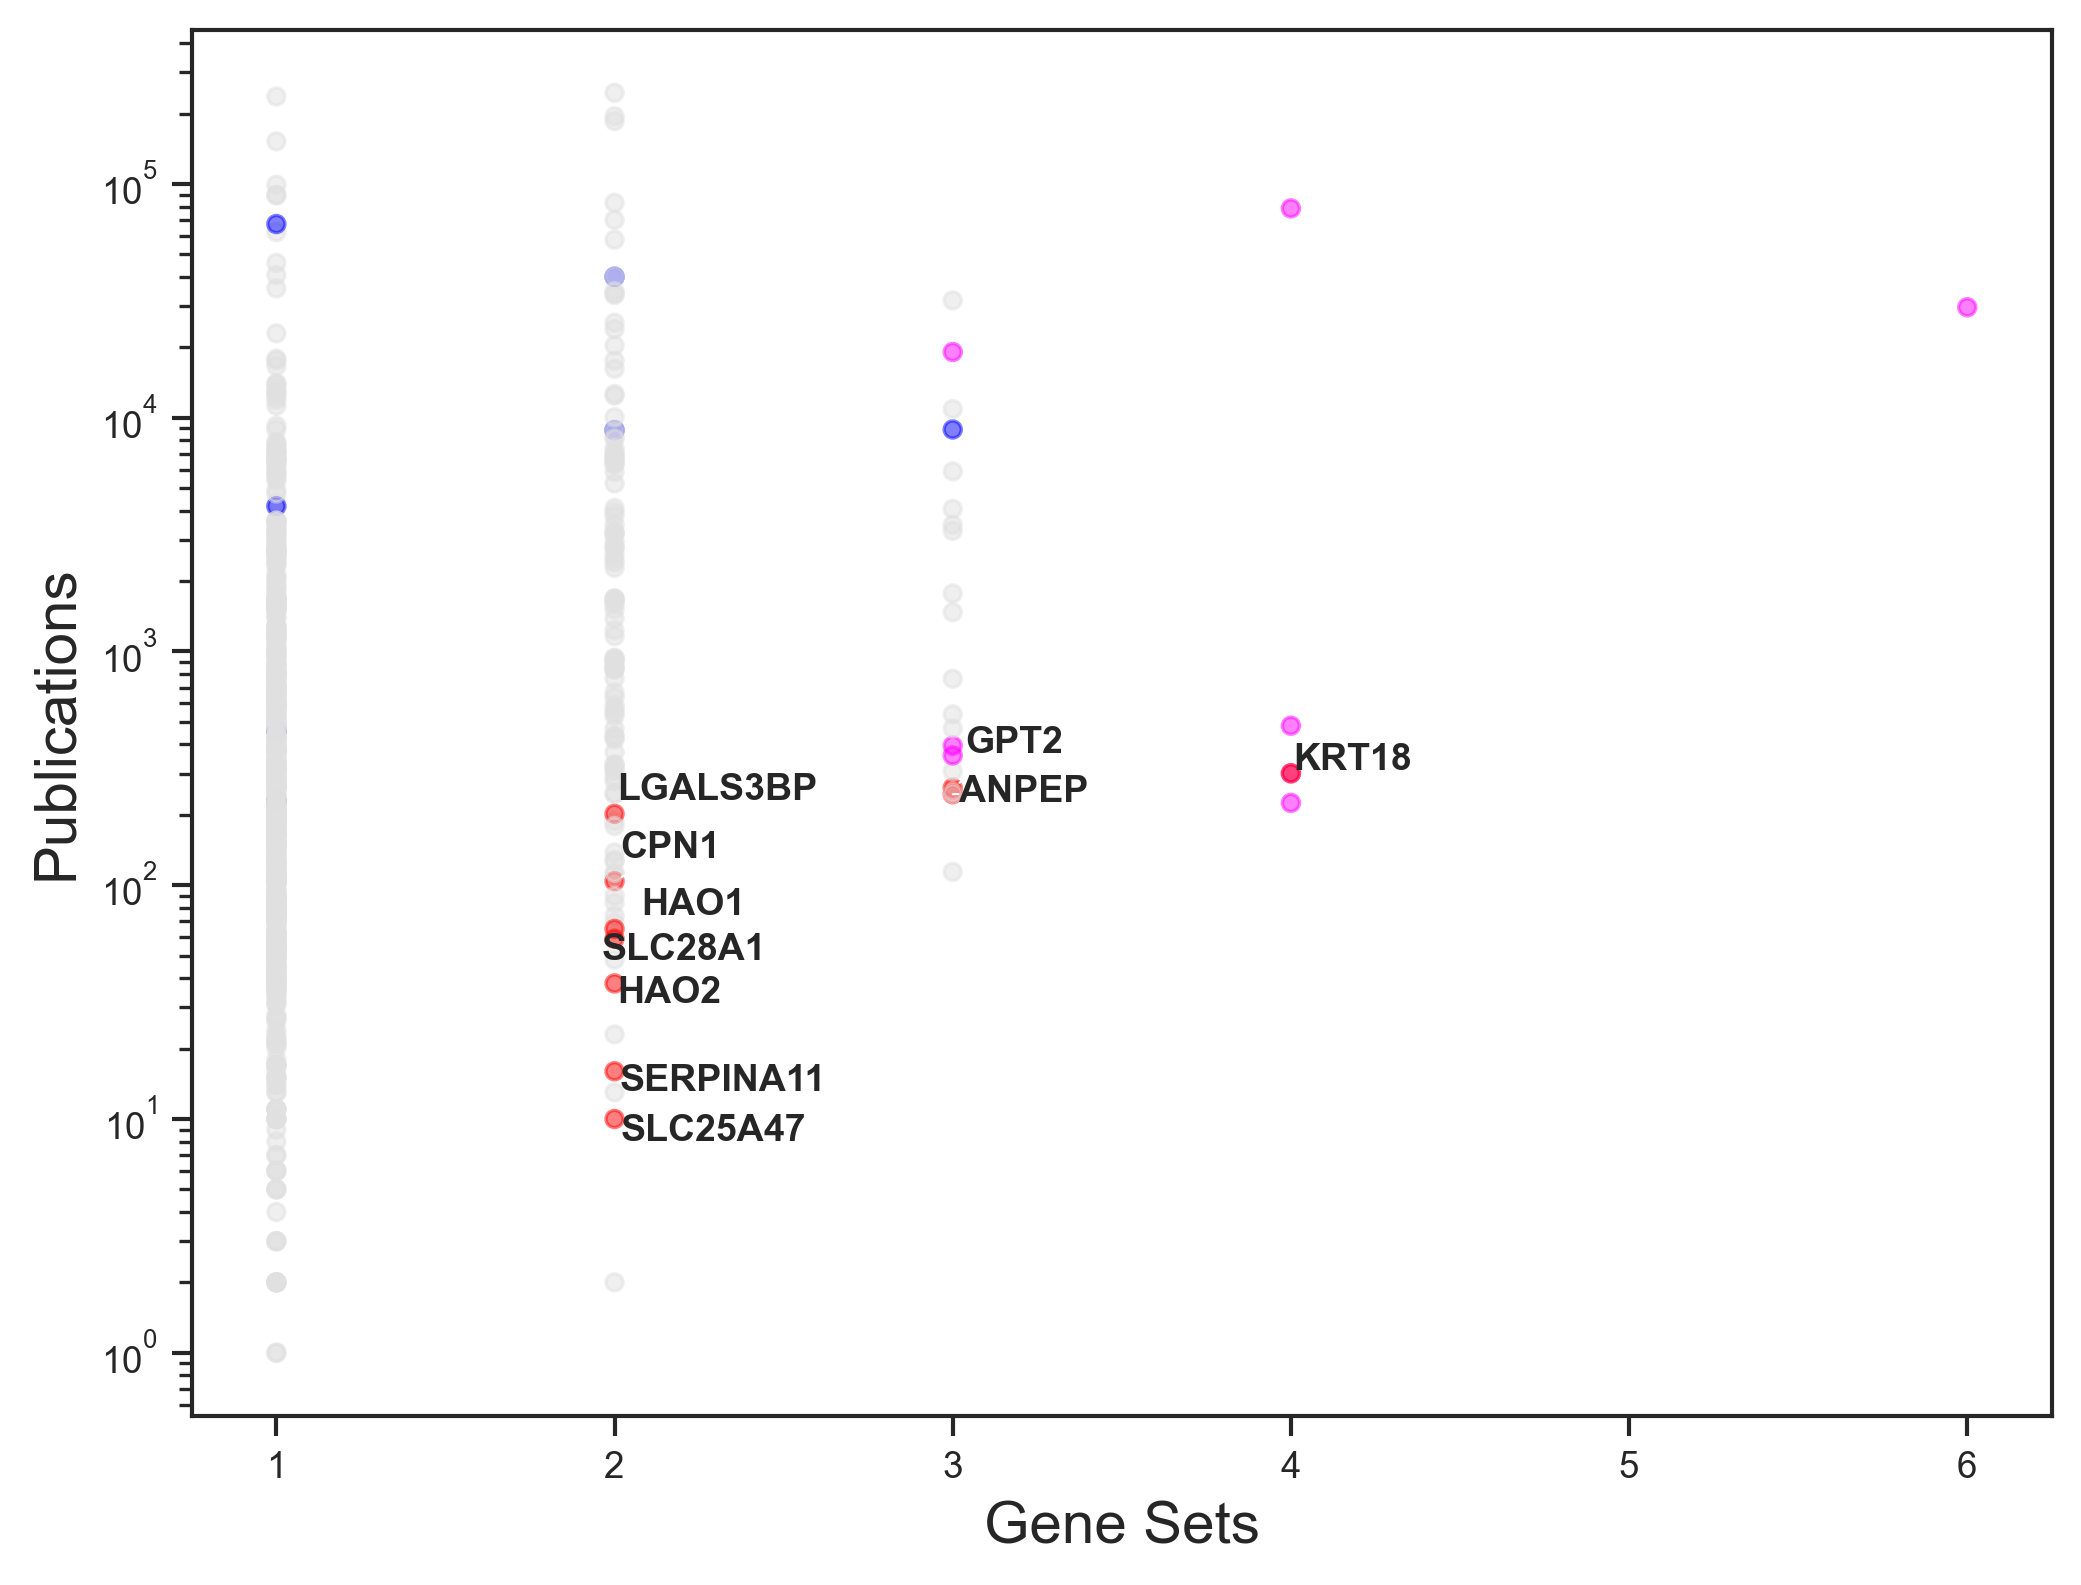
Figure: Scatterplot of publication counts vs gene set counts across all liver gene sets for each of the MASH genes. Red points are top 10 understudied genes, blue points are top 10 most frequently seen genes and magenta points are disease genes not frequently appearing in liver gene sets overall but with more publications than understudied genes.
In figure 1, we plot publication counts and gene set counts for each MASH gene using the counts across all liver disease gene sets. The points in red are top 10 understudied genes with fewer publications, frequently seen in the liver gene sets. Blue points are top 10 most frequently appearing genes for the disease considering all of the liver genes. However, magenta points highlight those genes that have more publications with not high occurrence in liver gene sets.
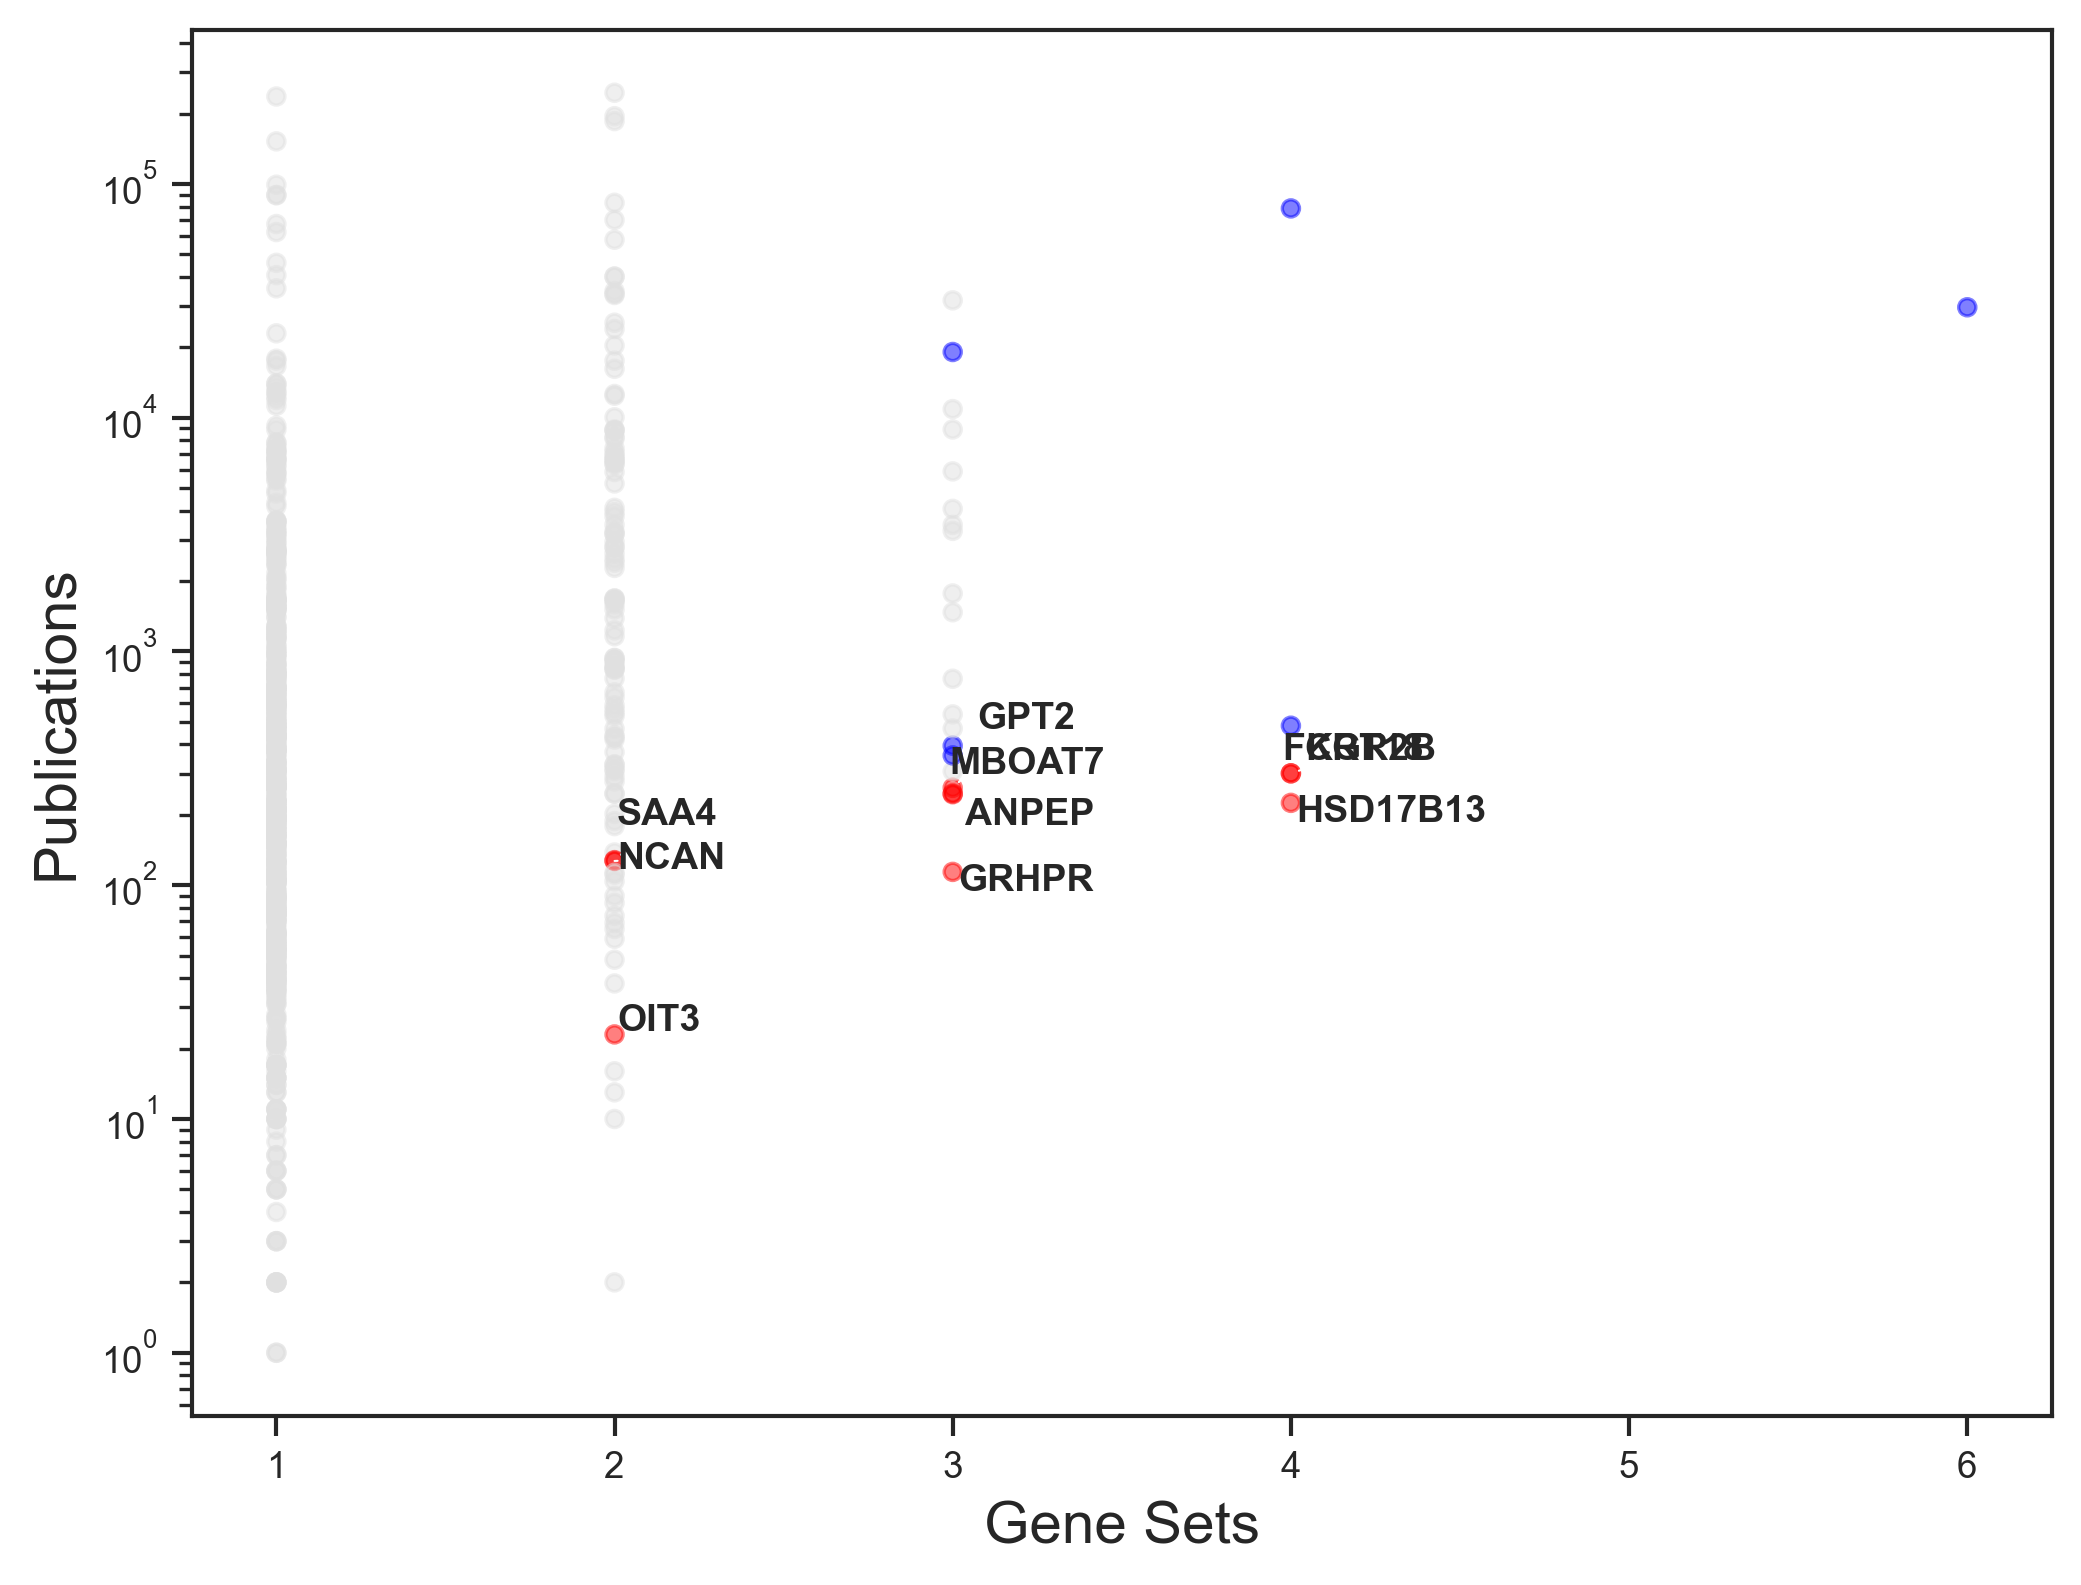
Figure: Scatterplot of publication counts vs gene set counts across only MASH gene sets for each of the MASH genes. Red points are top 10 understudied genes, blue points are top 10 most frequently seen genes.
In figure 2, we plot publication counts and gene set counts for each MASH gene using only the MASH disease gene sets. The points in red signify top 10 understudied genes with fewer publications and high frequency in MASH gene sets, while the blue points are top 10 frequently appearing genes in the MASH gene sets. The top 10 understudied genes for MASH are - GPT2, NCAN, ANPEP, GRHPR, SAA4, MBOAT7, OIT3, KRT18, FCGR2B and HSD17B13.
Another approach to get understudied genes for disease could be to use GSFM model to augment the disease genes for MASH from MONDO resource and get unknown highly related genes for MASH.
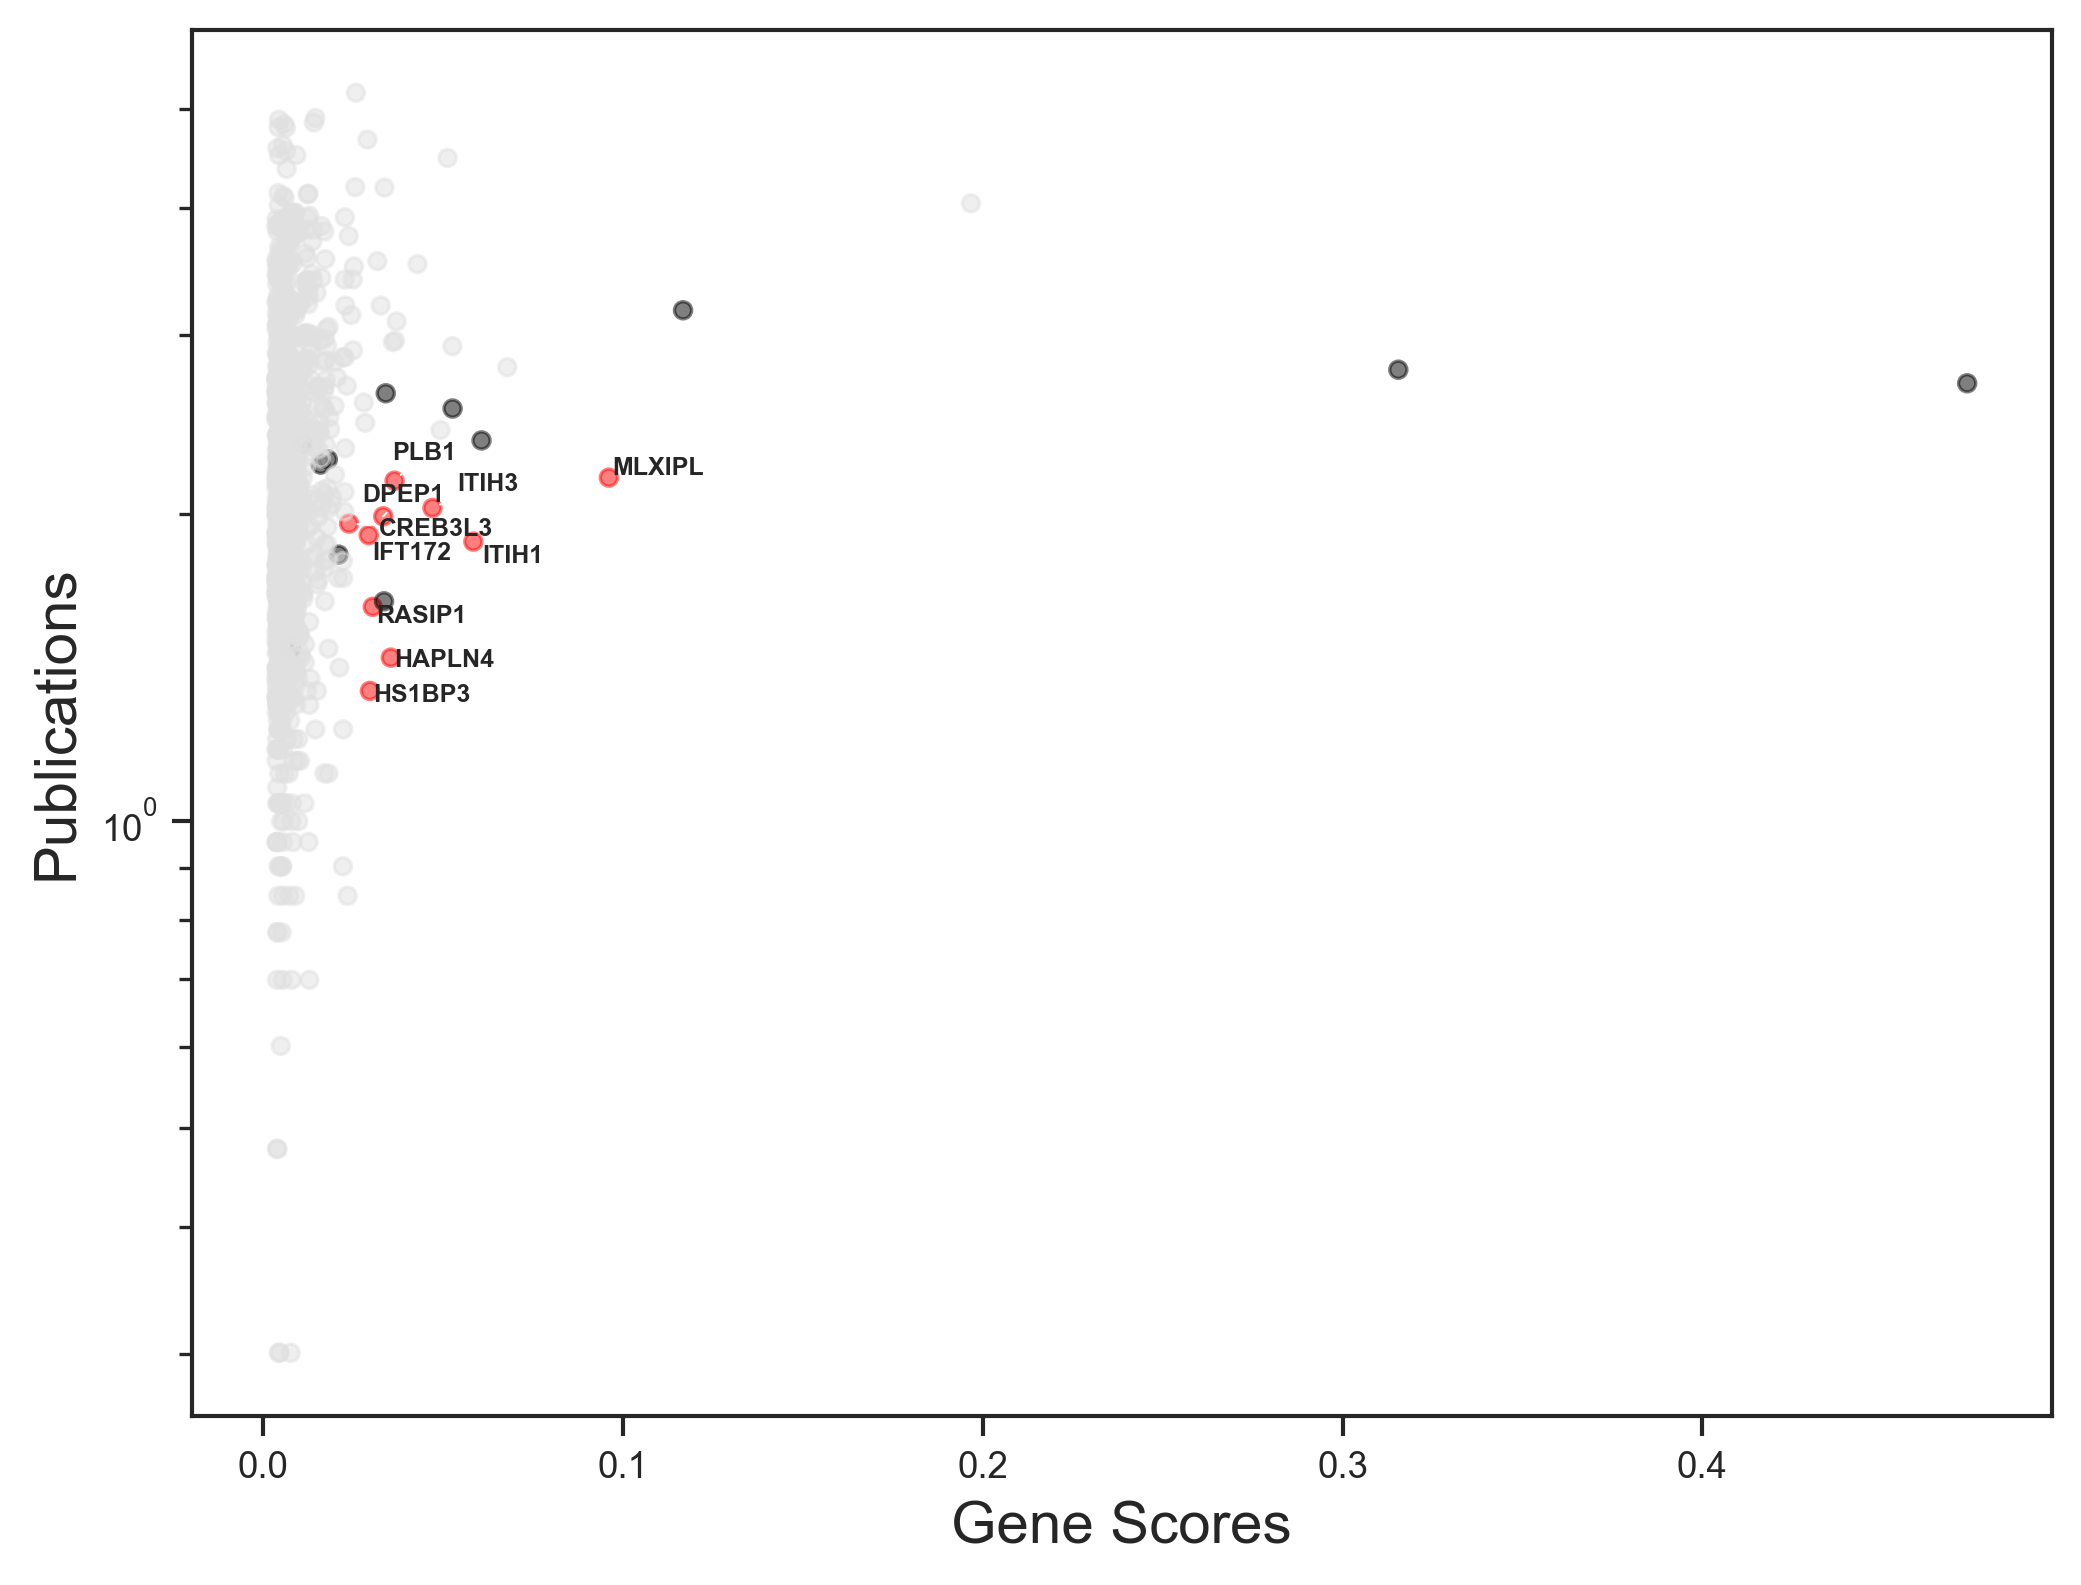
Figure: Scatterplot of publication counts vs GSFM gene scores for each of the predicted MASH genes. Red points are top 10 understudied genes with high GSFM scores but fewer publications, blue points are top 10 genes with high GSFM scores.
In figure 3, we plot publication counts and GSFM gene scores for each of the predicted MASH genes from GSFM by augmenting the MONDO disease genes for MASH. The red points are top 10 genes with fewer publications and high GSFM scores that are not in the input MONDO MASH genes, while the black points are top 10 genes that have high GSFM scores. The top 10 understudied genes with high GSFM scores not in the disease genes are - RASIP1, MLXIPL, HAPLN4, CREB3L3, ITIH3, HS1BP3, IFT172, DPEP1, ITIH1 and PLB1.
These understudied genes identified might play a unexplored critical role in the pathology of MASH that should be analyzed further through valid scientific RNA-seq experiments that knockout the genes in the healthy vs MASH disease samples.
To understand the role these understudied genes play in MASH pathology, we can find GEO studies where some of these genes are significantly up or down regulated for MASH. Using RummaGEO, we can get these differentially expressed gene signatures related to MASH. Details of the GEO studies for these signatures are listed in table 1.
Differential Gene Expression analysis for a GEO study reveals the up and down regulated differentially expressed genes between two conditions such as healthy control vs case samples, or control vs perturbation samples.
For MASH GEO study GSE180882, raw counts data can be downloaded from NCBI FTP server or from ARCHS4 platform that contains uniformly processed counts data available for all human and mouse GEO studies. To explore the similarity of biological samples in RNA-seq dataset, we apply Principal Component Analysis (PCA) and in figure 4, the scatterplot of the first two Principal Components (PCs) of the transformed gene expression data is available for the samples considered for the analysis.
To perform DGE analysis, Limma-voom, technique is appiled to this raw counts data after clear case and control samples are identified for the study. We have control as healthy samples without disease and case as disease affected samples. Identify differentially expressed genes (DEGs) by P-value < 0.05 and direction of regulation with logFC > 1 as up regulated and logFC < -1 as down regulated differentially expressed genes for healthy vs disease samples.
In figure 5, a volcano plot shows the DEGs identified for GSE180882 study. Since this study contains samples of Healthy and chronic MASH sample, we get the genes whose expression profiles have significantly changed in the MASH disease compared to healthy samples.
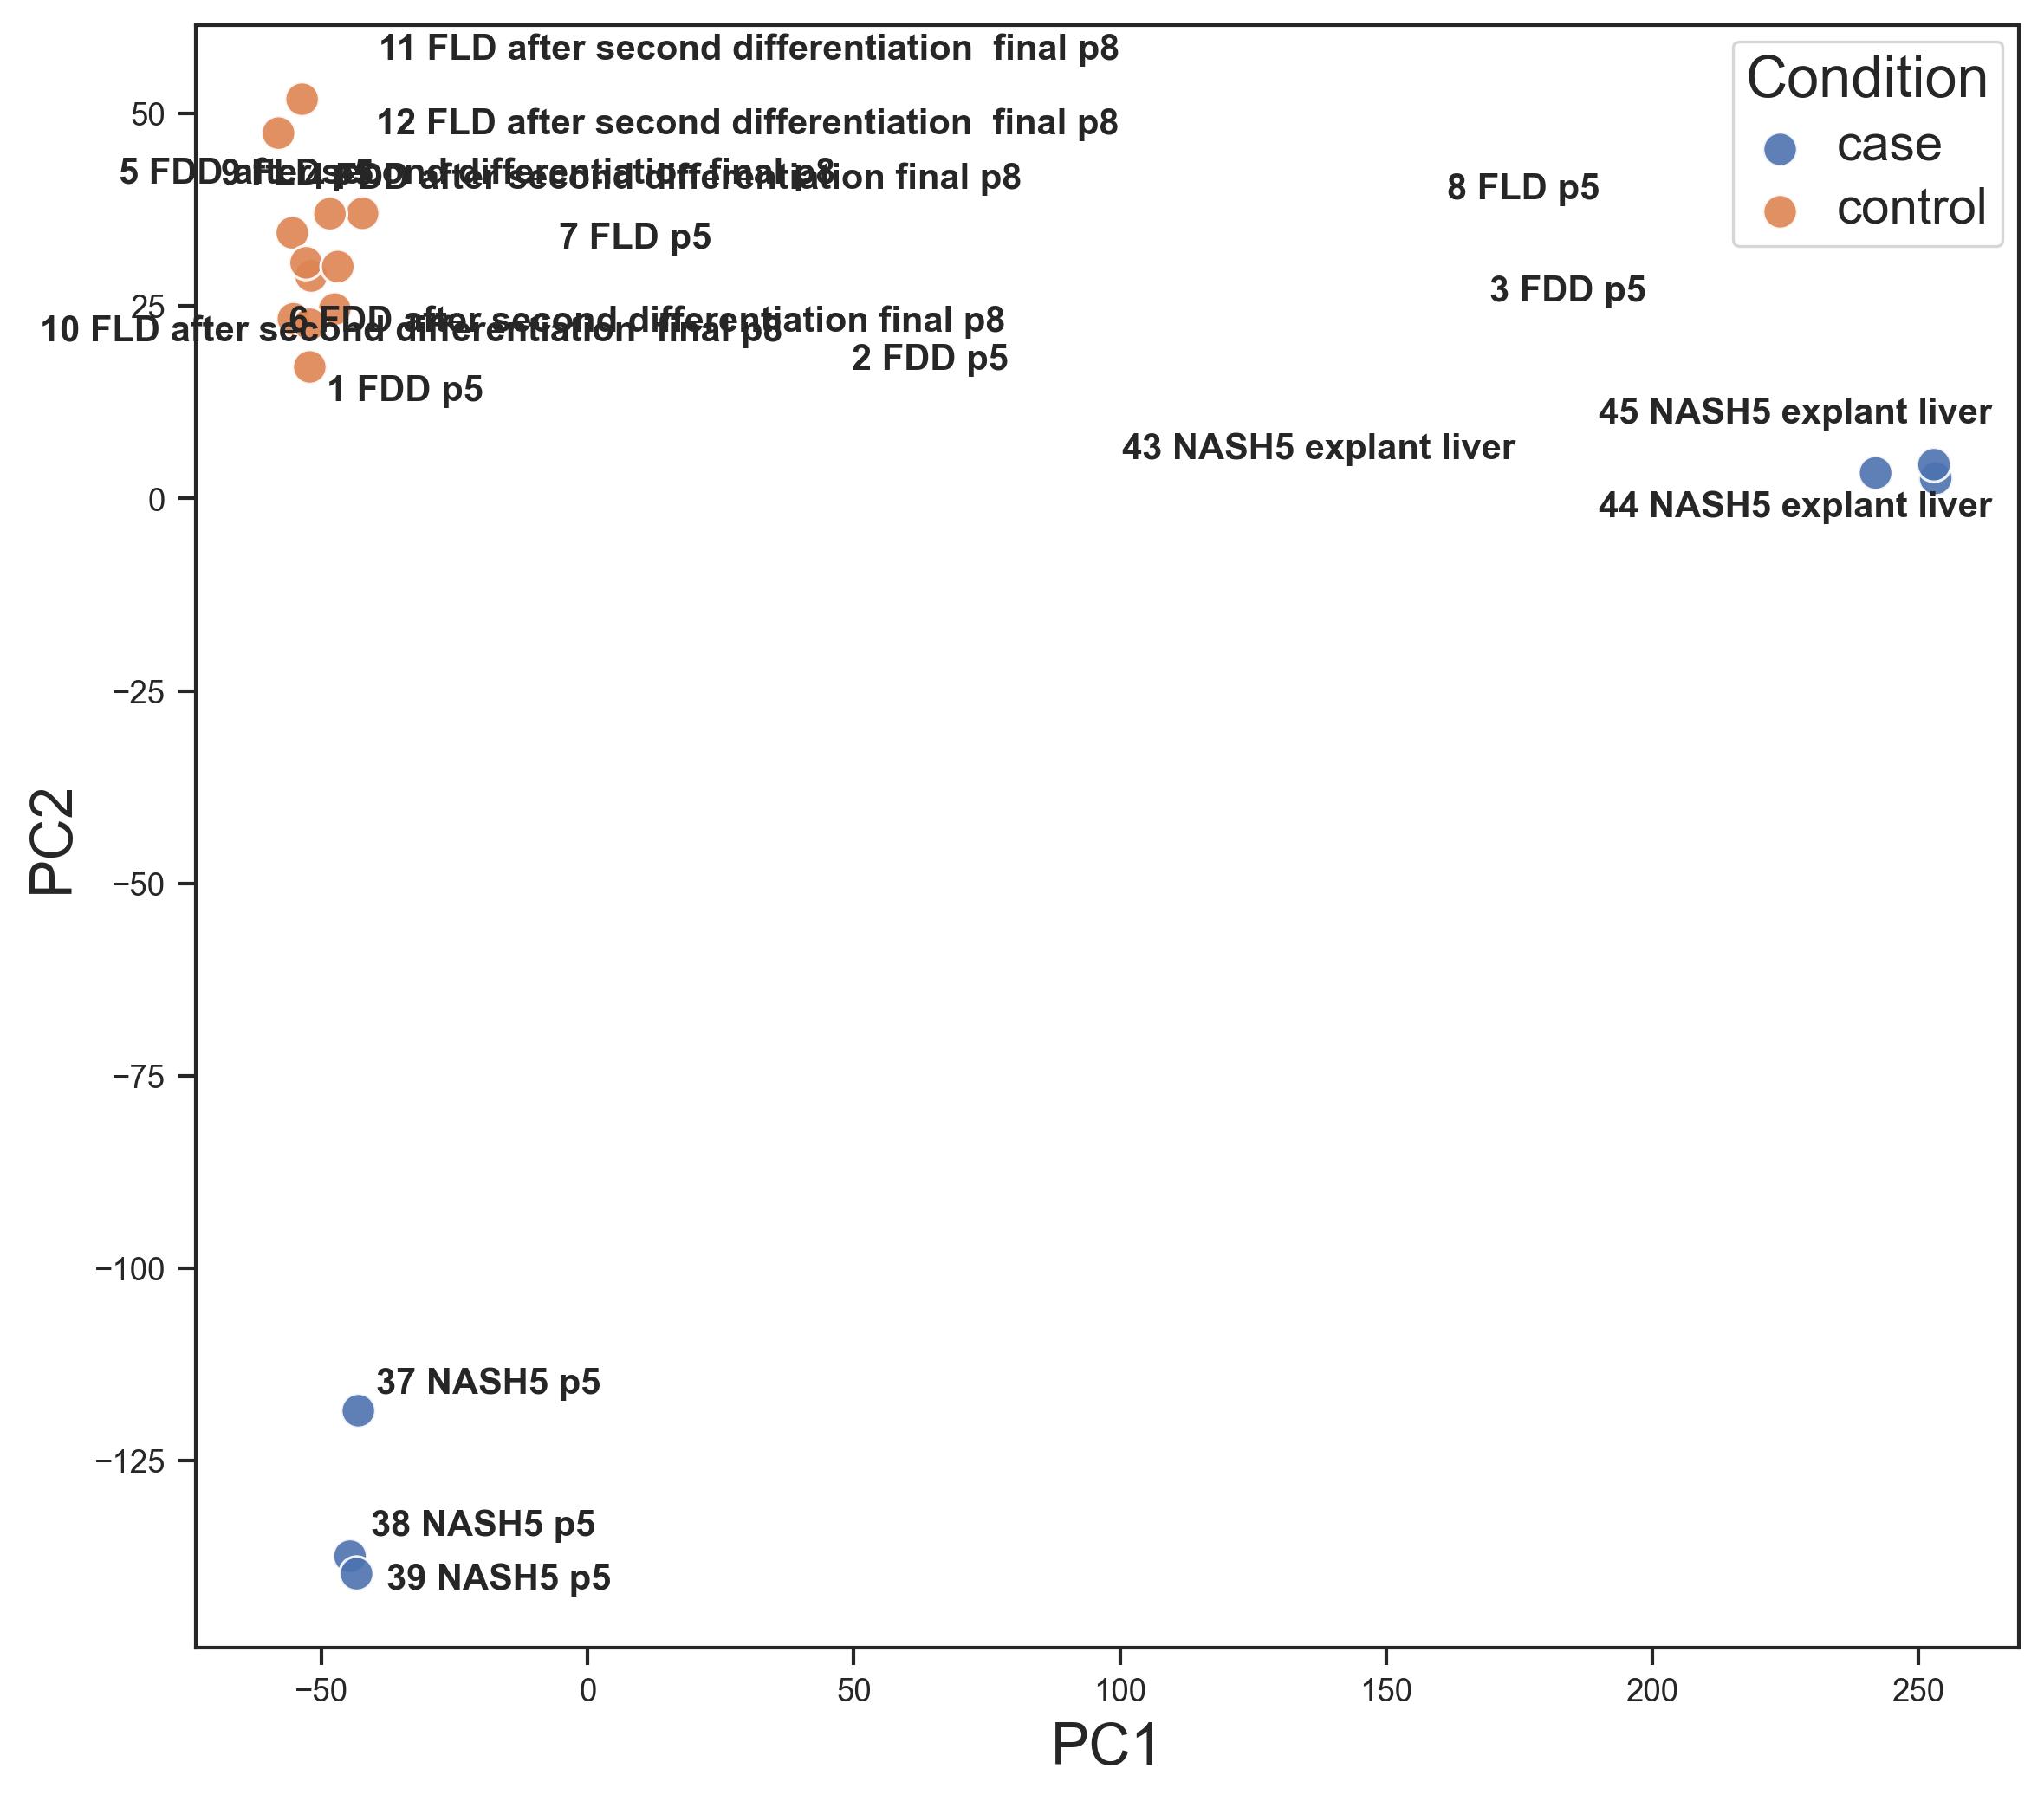
Figure: PCA plot of control and disease samples from the GEO study GSE180882. Blue points are control samples and orange points are disease samples. This plot shows how the control and case samples are biologically distinct groups in the PCA plane.
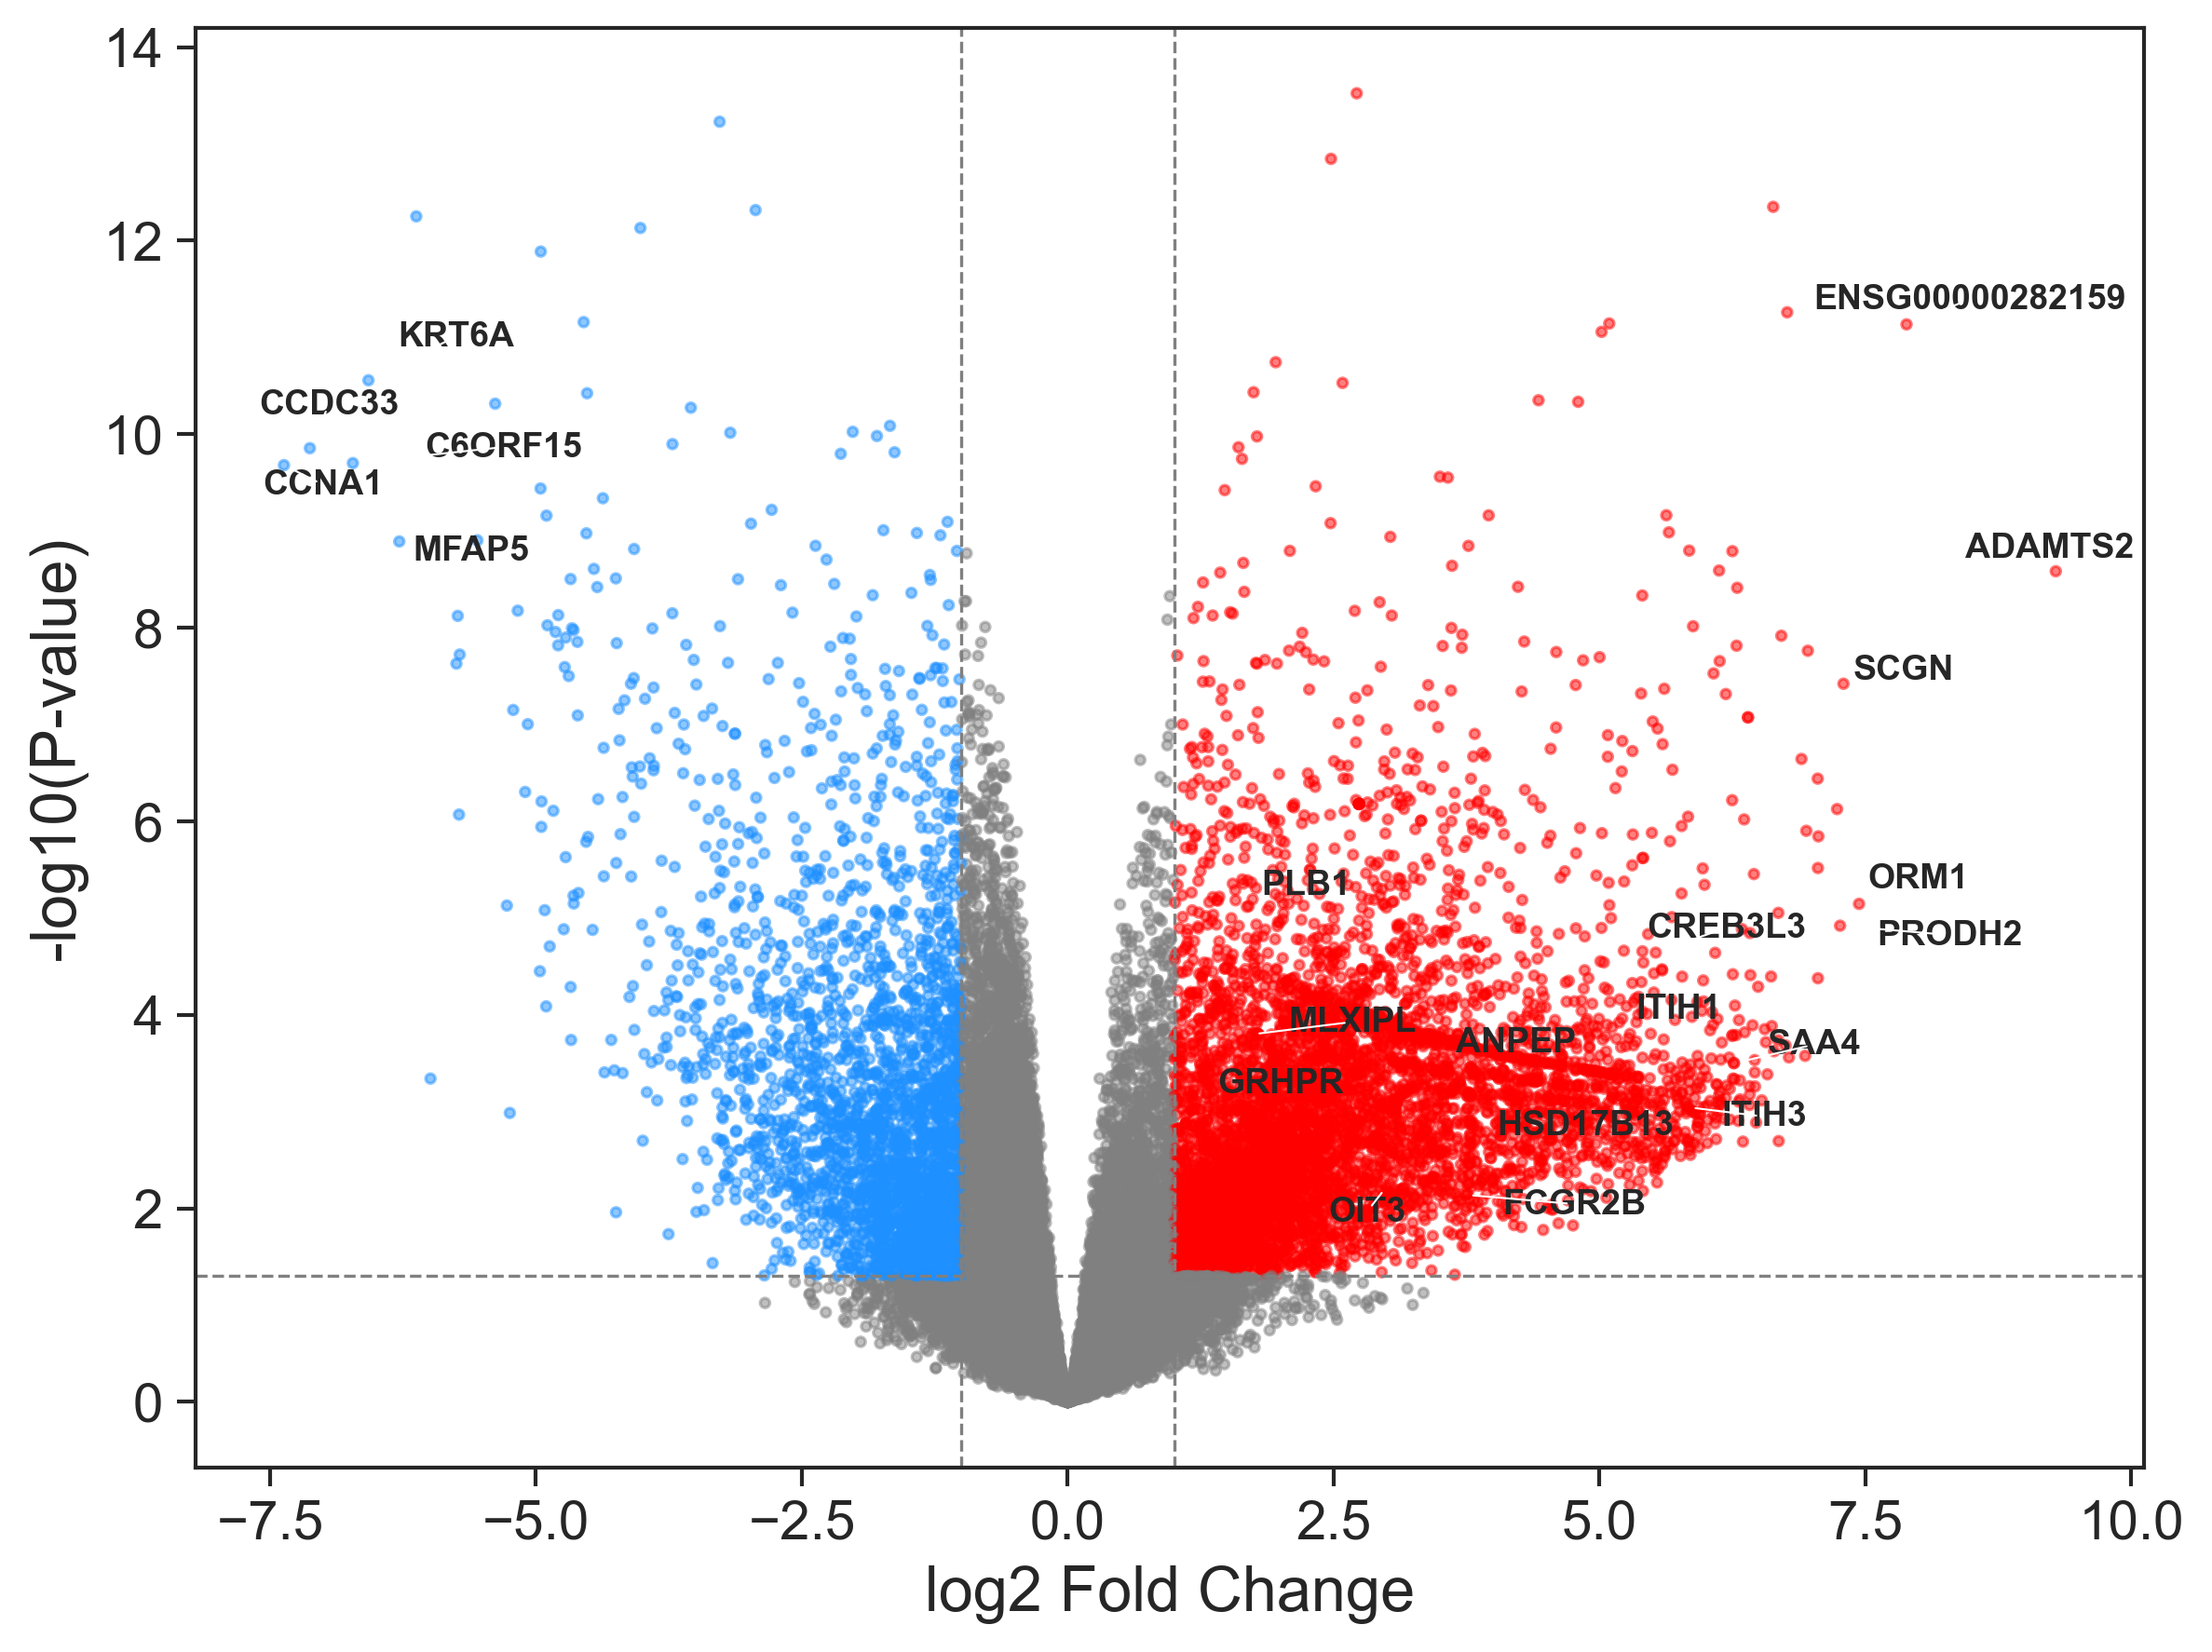
Figure: Volcano plot of P-value and LogFC on the limma-voom results for the GEO study for the Healthy Control vs MASH samples.
Understudied genes {} {} are significantly down regulated in MASH samples compared to healthy ones. While understudied genes MLXIPL, CREB3L3, ITIH3, ITIH1, PLB1 ANPEP, GRHPR, SAA4, OIT3, FCGR2B, HSD17B13 are up regulated in MASH samples compared to healthy samples.
For the list of up and down regulated genes we can then perform enrichment analysis using Enrichr API to get enriched terms with these DEGs as input queries as seen in figure 6 and figure 7.
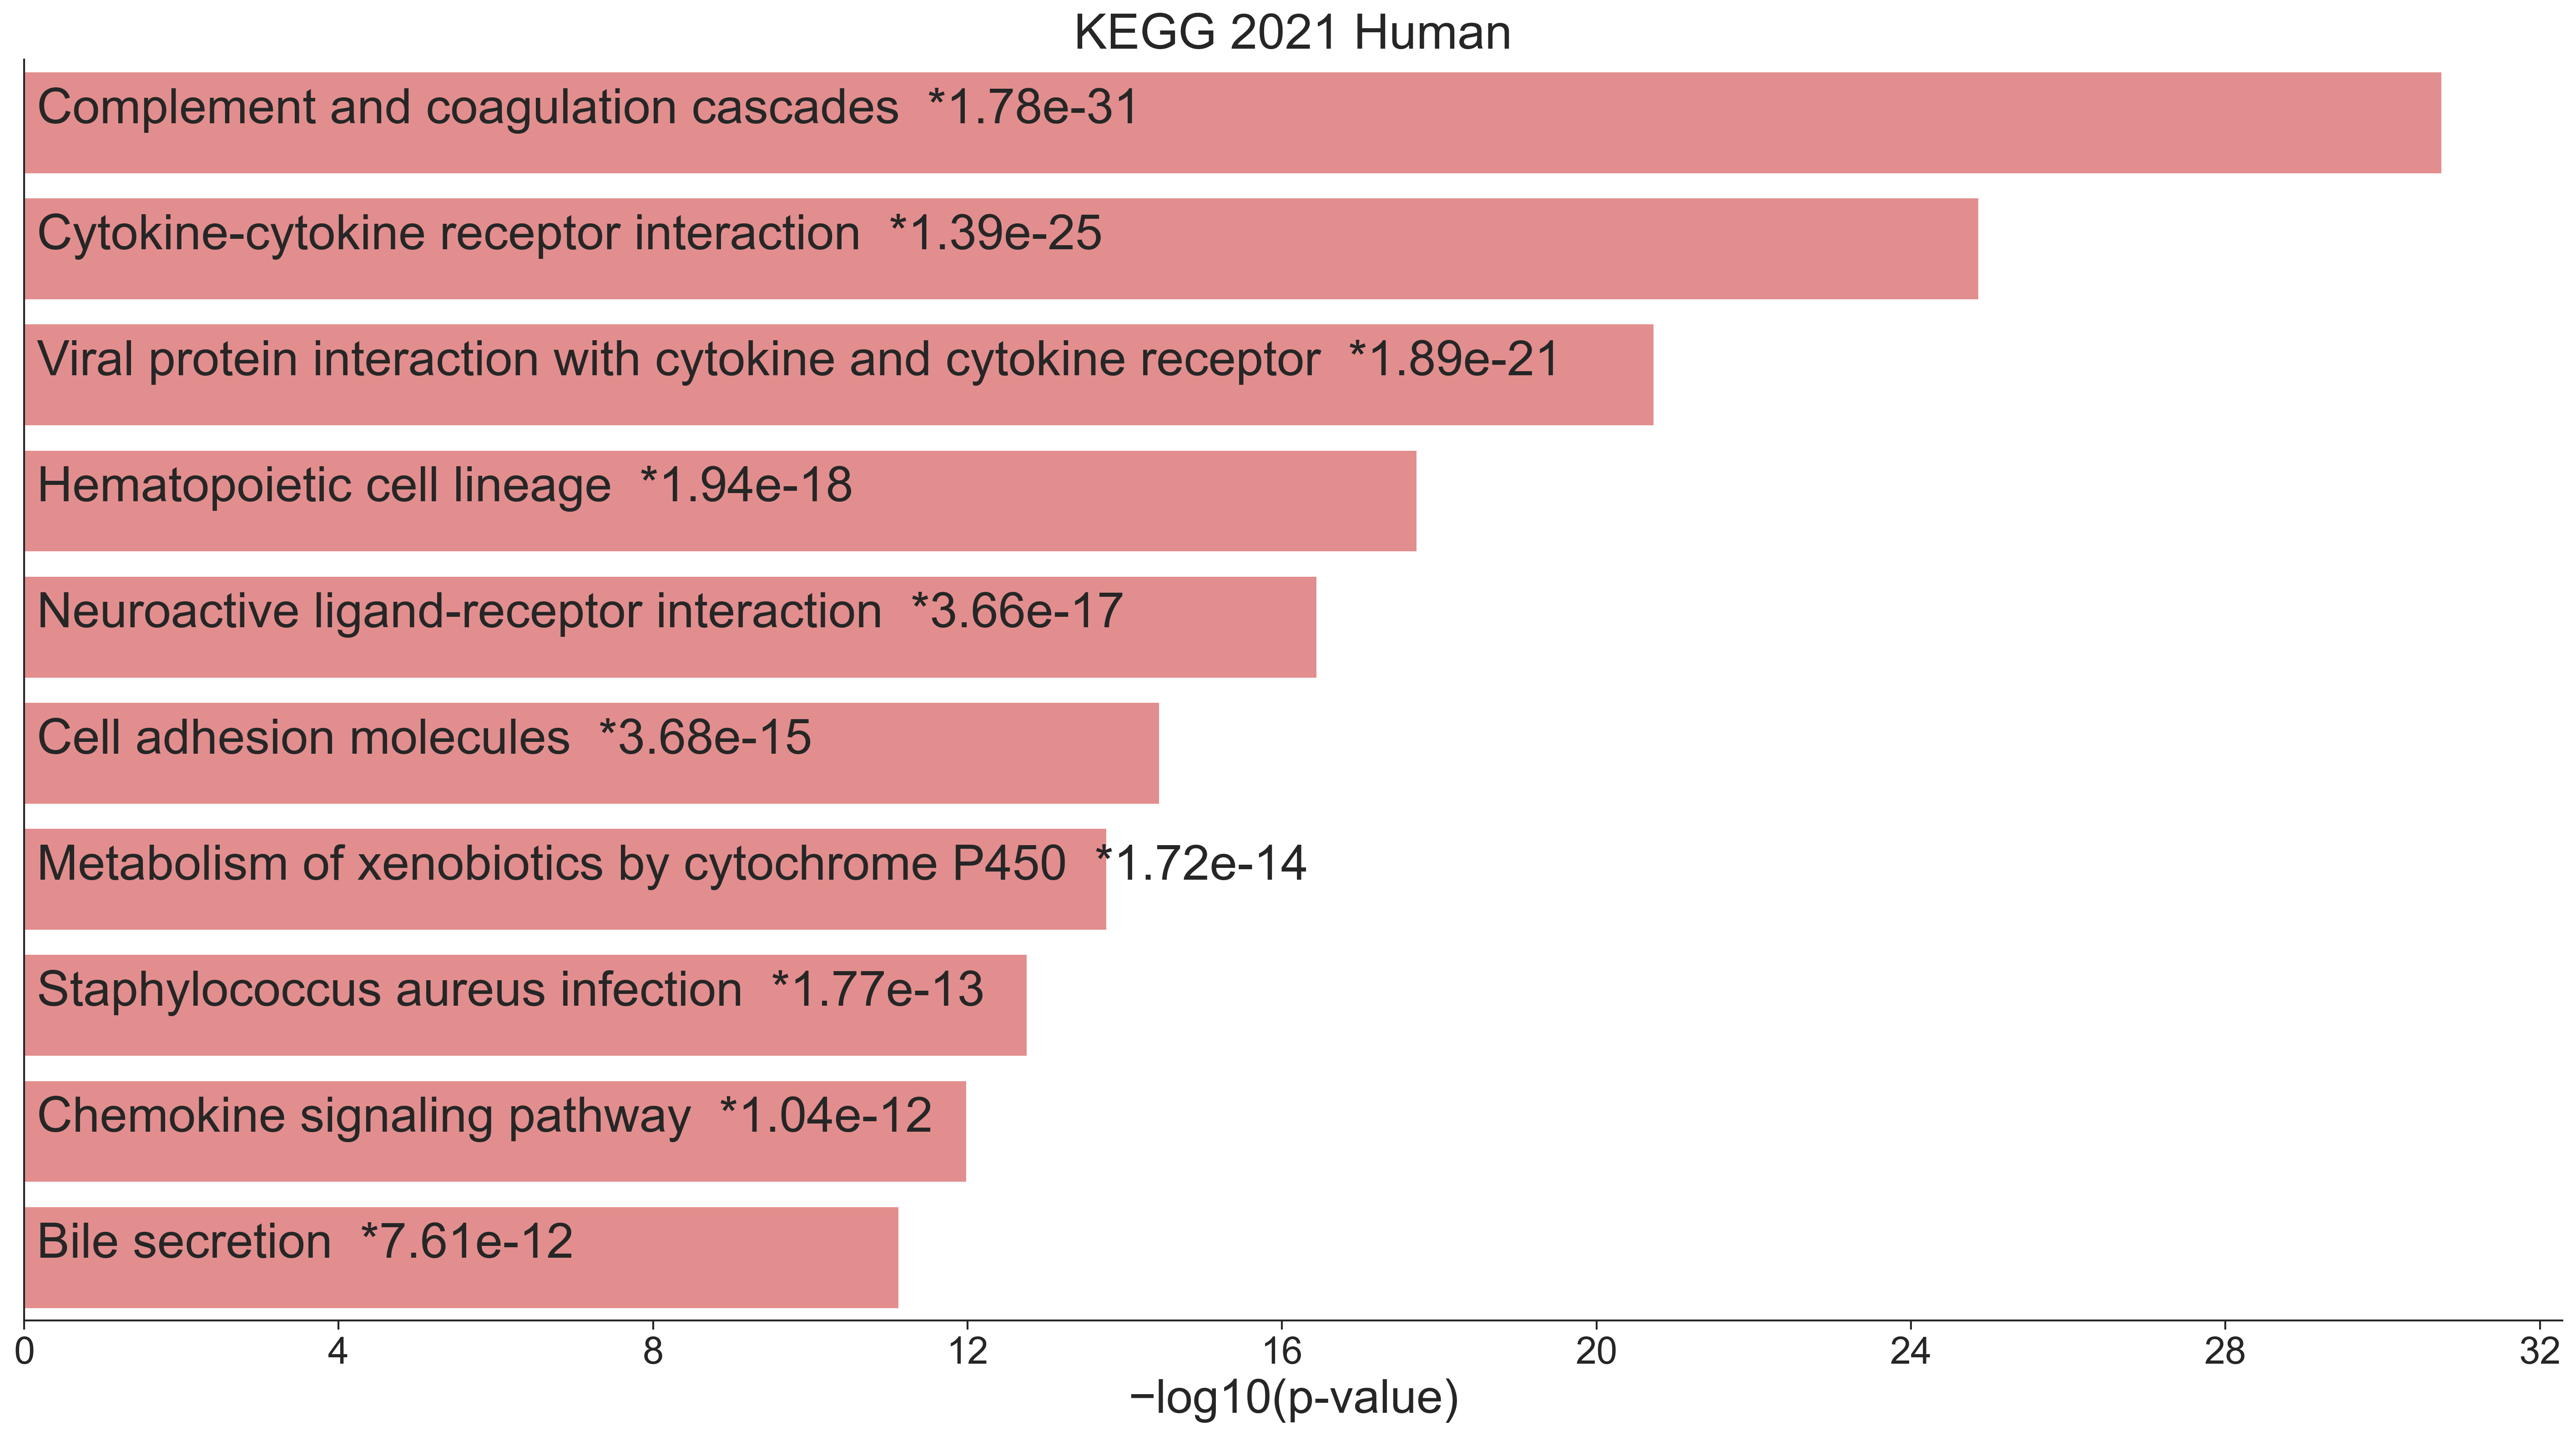
Figure: Bar chart of top enriched terms from the KEGG_2021 Human gene set library. The top 10 enriched terms for the input down gene set are displayed based on the -log10(p-value), with the actual p-value shown next to each term. The term at the top has the most significant overlap with the input down gene set in the case of Healthy Control vs MASH_
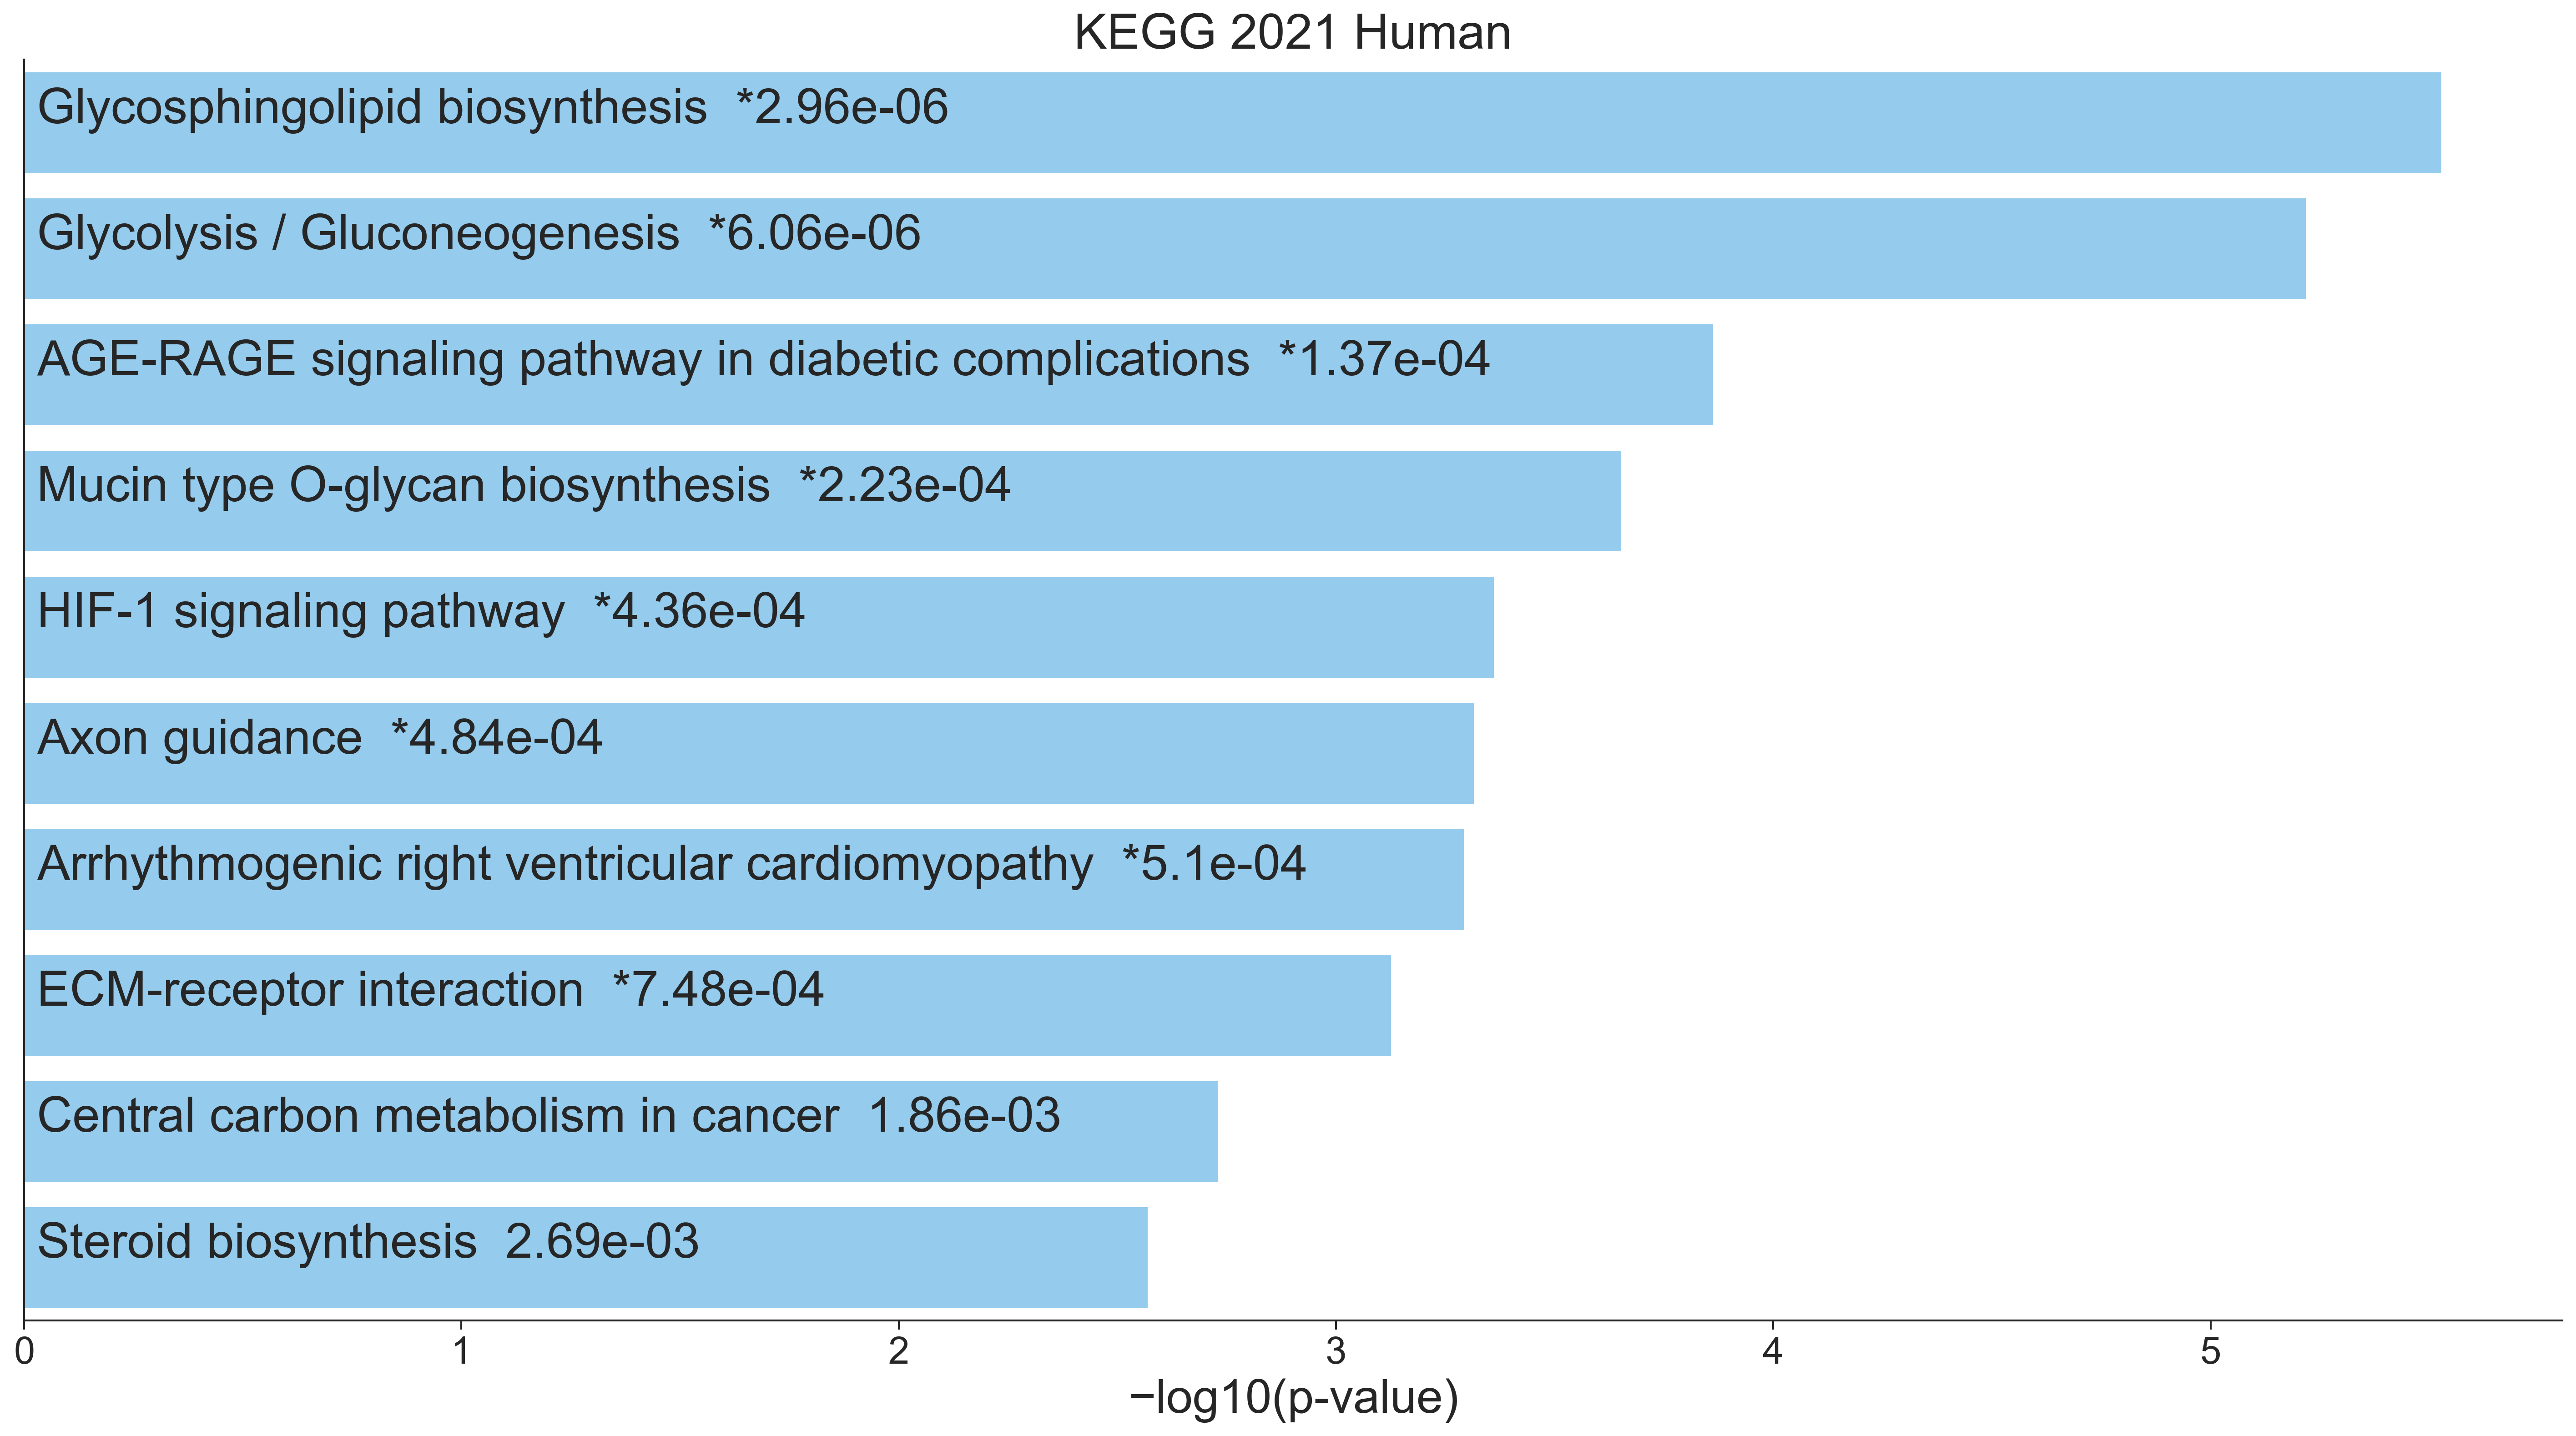
Figure: Bar chart of top enriched terms from the KEGG 2021_ Human gene set library. The top 10 enriched terms for the input up gene set are displayed based on the -log10(p-value), with the actual p-value shown next to each term. The term at the top has the most significant overlap with the input up gene set in the case of Healthy Control vs MASH_
Using both the up and down genes, we can get drugs, perturbations from L2S2 associated with the gene signatures searched. Details of the drug predictions are available in table 2.
Figure: RummaGEO differential expression signatures for MASH
Figure: Drug predictions from L2S2 using up and down gene set search
Methods
Detailed introduction on the disease from DeepDive2.0
The introduction section for this article was generated from DeepDive2.0 for MASH. First, the DeepDive workflow starts from the input disease term in this case "MASH". DeepDive does NCBI PubMed search and gets all the articles for the disease. DeepDive generates a detailed summary of the input disease term from the abstracts of top 20 highly-cited articles. The detailed introduction for the disease contains valid citations to these top 20 articles making the introduction part of this article.
Potentially understudied genes from disease-associated genes
The gene sets for the MASH disease was extracted from resources - Enrichr, RummaGEO, Rummagene, Geneshot, MONDO, DO, GWAS Catalog and ClinVar. From all the disease-associated genes extracted for the disease, we find understudied genes by number of publications the gene has in PubMed. Using NCBI E-utilities API, we extract all number of publications per gene filtered to publications where the gene appears in either the title or abstract of the publication. We create 2 scatter plots of publication counts vs frequency of the gene considering all liver diseases gene sets and considering just the MASH disease gene sets. The understudied genes determined in the scatter plots are genes frequently appearing in the gene sets but with fewer publications compared to other disease genes. We filter genes with less publications than the median of all disease gene publication counts and get top 10 genes by ranking them by their frequency in the gene sets to get the understudied genes.
Understudied genes from GSFM
Another approach to get understudied genes for a disease is using Gene Set Foundational Model (GSFM), to augment the disease genes extracted for the disease from either MONDO or GWAS catalog resource. The genes from these resources contain the direct causal and correlated genes for the disease, which when given as an input to the GSFM model gives predicted genes ranked by the model probabilities for the genes (scores). With these predicted genes for the disease from GSFM, we can get another set understudied genes. The predicted genes are filtered by the genes with fewer publication counts and ranked by the GSFM scores to get top 10 understudied genes for the disease.
Differentially gene expression analysis of a GEO study
From the many GEO studies with up and down signatures for a disease term from RummaGEO, we pick the GEO whose signatures contain most understudied genes found for the disease. We then perform Differentially Gene Expression (DGE) analysis on the gene expression data for the study, GSE180882 for MASH. We compute the significantly up and down regulated genes comparing healthy control to MASH samples using Limma-voom, technique. Significantly expressed genes are determined by p-value < 0.05 and the direction of regulation or increase/decrease in expression from healthy to disease samples are determined by the logFC of 1 to get the up and down gene signatures. These up and down genes are given as separate inputs to Enrichr to fetch enrichment results for the input from KEGG 2021 library and these up and down signatures are given together as input for L2S2 up and down signature search to fetch drug predictions for these differentially expressed genes.
Discussion
The present study leveraged a multi‑resource, data‑driven pipeline to uncover genes that are recurrently implicated in metabolic dysfunction‑associated steatohepatitis (MASH) yet remain under‑explored in the biomedical literature. By integrating gene sets derived from a broad spectrum of curated databases (Enrichr, RummaGEO, Rummagene, Geneshot, MONDO, DO, GWAS Catalog, ClinVar) with quantitative PubMed publication metrics, we identified two complementary panels of understudied candidates:
- Frequency‑driven understudied genes – ten genes (e.g., GPT2, NCAN, ANPEP, GRHPR, SAA4, MBOAT7, OIT3, KRT18, FCGR2B, HSD17B13) that appear frequently across liver‑related gene sets but have fewer than median PubMed citations.
- Model‑driven understudied genes – ten genes (e.g., RASIP1, MLXIPL, HAPLN4, CREB3L3, ITIH3, HS1BP3, IFT172, DPEP1, ITIH1, PLB1) that receive high relevance scores from the Gene Set Foundational Model (GSFM) despite limited publication records.
Biological relevance of the identified genes
Several of the frequency‑driven genes have established links to hepatic metabolism or fibrosis, albeit primarily in contexts outside of MASH. For instance, MBOAT7 variants have been associated with altered phosphatidylinositol remodeling and susceptibility to fatty liver disease, while HSD17B13 encodes a hepatic lipid droplet protein whose loss‑of‑function alleles confer protection against chronic liver injury. The presence of these genes in our top‑ranked list validates the pipeline’s ability to capture biologically plausible candidates.
Conversely, the model‑driven set contains genes with scant prior liver‑centric literature but with functional annotations that suggest potential involvement in MASH pathophysiology. CREB3L3, a transcription factor governing hepatic lipid homeostasis, and MLXIPL (also known as ChREBP) are central regulators of de novo lipogenesis; their emergence underscores the capacity of GSFM to prioritize mechanistically relevant genes independent of citation bias. Other candidates such as ITIH3 and ITIH1 belong to the inter‑α‑trypsin inhibitor family, which modulates extracellular matrix composition—a process intimately linked to fibrosis progression.
Integration with transcriptomic evidence
Differential expression analysis of the GEO dataset GSE180882 (healthy versus MASH organoid samples) provided an orthogonal validation layer. Several understudied genes were significantly dysregulated in disease samples: ANPEP, GRHPR, SAA4, OIT3, FCGR2B, and HSD17B13 were up‑regulated, whereas MLXIPL, CREB3L3, ITIH3, ITIH1, and PLB1 were down‑regulated. The concordance between gene‑set frequency, model prediction, and actual transcriptional perturbation strengthens the hypothesis that these loci contribute to MASH biology and merit experimental interrogation.
Enrichment of the up‑ and down‑regulated signatures in KEGG pathways highlighted metabolic and inflammatory circuits (e.g., fatty acid degradation, cytokine‑cytokine receptor interaction), consistent with the known hallmarks of MASH. Moreover, drug‑perturbation mining via L2S2 identified candidate compounds (e.g., dacomitinib) whose transcriptional footprints inversely correlate with the disease signatures, suggesting potential repurposing opportunities that could be prioritized based on the involvement of understudied genes.
Limitations
Several constraints temper the interpretation of our findings. First, the reliance on PubMed citation counts as a proxy for “study depth” may inadvertently penalize newer genes that have emerged in the last few years but are already the focus of intensive investigation. Second, the gene‑set aggregation across heterogeneous resources introduces variable curation standards; some databases emphasize genetic association, others functional annotation, which may bias the frequency metric. Third, the GSFM model, while powerful, is trained on existing knowledge bases and could propagate hidden biases present in the training data. Finally, the transcriptomic validation is limited to a single GEO dataset derived from organoid cultures; broader validation across independent cohorts, tissue types, and disease stages is required to generalize the observations.
Future directions
To translate these computational insights into mechanistic understanding, we propose the following next steps:
- Targeted functional assays: CRISPR‑mediated knockout or overexpression of top understudied genes in hepatocyte and hepatic stellate cell models, followed by phenotypic readouts (lipid accumulation, inflammatory cytokine release, extracellular matrix deposition).
- Multi‑omics integration: Combine proteomics, metabolomics, and epigenomics from MASH patient biopsies to assess whether the identified genes exert regulatory influence at additional molecular layers.
- Human genetics validation: Query large‑scale biobanks (e.g., UK Biobank, All of Us) for rare or common variants in the understudied genes and test for association with liver imaging or histologic outcomes.
- Therapeutic exploration: Leverage the drug‑perturbation signatures to design in‑vitro screens of candidate compounds, focusing on those that modulate the expression or activity of the understudied genes.
- Network modeling: Incorporate the new genes into liver‑specific regulatory networks to predict downstream effectors and potential synergistic targets.
Collectively, these efforts will clarify whether the understudied genes represent novel drivers of MASH pathogenesis, biomarkers of disease progression, or therapeutic leverage points. By systematically surfacing and prioritizing such genes, the present work contributes a roadmap for expanding the molecular toolkit available to combat the growing global burden of metabolic liver disease.
Acknowledgements
This manuscript used assistance from the Ollama GPT ‑OSS:120b large language model and DeepDive2.0 resource.
References
-
Rinella (2023) A multisociety Delphi consensus statement on new fatty liver disease nomenclature. J Hepatol. DOI: 10.1016/j.jhep.2023.06.003 ↩ ↩2 ↩3
-
{European Association for the Study of the Liver (EASL) (2024) EASL-EASD-EASO Clinical Practice Guidelines on the management of metabolic dysfunction-associated steatotic liver disease (MASLD). J Hepatol. DOI: 10.1016/j.jhep.2024.04.031 ↩ ↩2 ↩3 ↩4 ↩5
-
Targher (2024) MASLD: a systemic metabolic disorder with cardiovascular and malignant complications. Gut. DOI: 10.1136/gutjnl-2023-330595 ↩
-
Loomba (2024) Tirzepatide for Metabolic Dysfunction-Associated Steatohepatitis with Liver Fibrosis. N Engl J Med. DOI: 10.1056/NEJMoa2401943 ↩ ↩2
-
Lachmann (2018) Massive mining of publicly available RNA-seq data from human and mouse. Nature Communications. DOI: 10.1038/s41467-018-03751-6 ↩
-
Law (2014) voom: precision weights unlock linear model analysis tools for RNA-seq read counts. Genome Biology. DOI: 10.1186/gb-2014-15-2-r29 ↩ ↩2
-
Ritchie (2015) limma powers differential expression analyses for RNA-sequencing and microarray studies. Nucleic Acids Research. DOI: 10.1093/nar/gkv007 ↩ ↩2
-
Xie (2021) Gene Set Knowledge Discovery with Enrichr. Current Protocols. DOI: 10.1002/cpz1.90 ↩ ↩2 ↩3
-
Marino (2025) L2S2: chemical perturbation and CRISPR KO LINCS L1000 signature search engine. Nucleic Acids Research. DOI: 10.1093/nar/gkaf373 ↩ ↩2
-
Marino (2025) L2S2: chemical perturbation and CRISPR KO LINCS L1000 signature search engine. Nucleic Acids Research. DOI: doi:10.1093/nar/gkaf373 ↩ ↩2
-
Clarke (2024) Rummagene: massive mining of gene sets from supporting materials of biomedical research publications. Communications Biology. DOI: 10.1038/s42003-024-06177-7 ↩
-
Lachmann (2019) Geneshot: search engine for ranking genes from arbitrary text queries. Nucleic Acids Research. DOI: 10.1093/nar/gkz393 ↩
-
Vasilevsky (2025) Mondo: Integrating Disease Terminology Across Communities. Genetics. DOI: 10.1093/genetics/iyaf215 ↩ ↩2
-
Schriml (2022) The Human Disease Ontology 2022 update. Nucleic Acids Research. DOI: 0.1093/nar/gkab1063 ↩
-
Buniello (2019) The NHGRI-EBI GWAS Catalog of published genome-wide association studies, targeted arrays and summary statistics. Nucleic Acids Research. DOI: 10.1093/nar/gky1120 ↩ ↩2
-
L (2014) ClinVar: public archive of relationships among sequence variation and human phenotype. Nucleic Acids Research. DOI: 10.1093/nar/gkt1113 ↩
-
Clarke (2025) A Gene Set Foundation Model Pre-Trained on a Massive Collection of Diverse Gene Sets. Preprint on bioRxiv. DOI: 10.1101/2025.05.30.657124 ↩
Peer review
No reviews yet.
History
Sign in to comment.