Under-studied Genes Likely Associated with Cirrhosis
›Details · v1 · 2 subjects · 1 attachment
Abstract
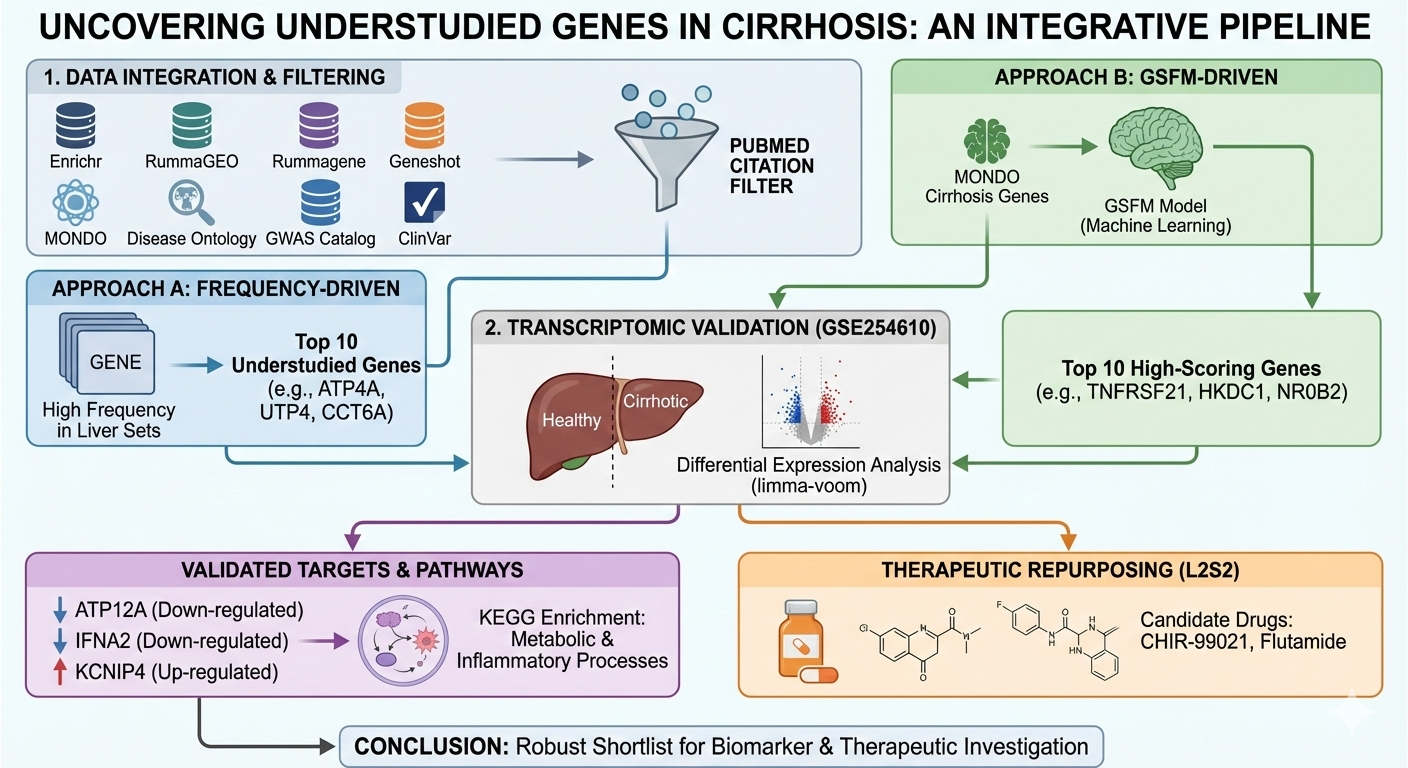
Cirrhosis remains a leading cause of liver‑related morbidity, yet many genes implicated in its pathology are poorly characterized. To uncover such neglected candidates, we aggregated cirrhosis‑associated gene sets from eight public resources (Enrichr, RummaGEO, Rummagene, Geneshot, MONDO, Disease Ontology, GWAS Catalog, ClinVar) and filtered them by PubMed publication counts, identifying ten “frequency‑driven” understudied genes that are repeatedly present in liver‑disease gene sets but cited less than the median (e.g., ATP4A, UTP4, CCT6A, ATP12A, IFNA2). In parallel, we applied the Gene Set Foundational Model (GSFM) to MONDO‑derived cirrhosis genes, selecting the top ten high‑scoring genes with few publications (e.g., TNFRSF21, HKDC1, NR0B2, KCNIP4). Differential expression analysis of the GEO dataset GSE254610 (healthy vs. cirrhotic liver) using limma‑voom confirmed that several frequency‑driven genes (notably ATP12A and IFNA2) are significantly down‑regulated, while a GSFM‑derived gene (KCNIP4) is up‑regulated. Enrichment of the resulting up‑ and down‑regulated signatures in KEGG pathways highlighted metabolic and inflammatory processes central to cirrhosis, and L2S2 drug‑perturbation screening suggested repurposing candidates such as CHIR‑99021 and flutamide. Our integrative pipeline—combining literature‑based filtering, machine‑learning prediction, and transcriptomic validation—provides a robust shortlist of understudied genes that merit functional investigation as potential biomarkers or therapeutic targets in cirrhosis.
Introduction
Cirrhosis, the end‑stage consequence of chronic liver injury, represents a major global health burden. Meta‑analytic estimates indicate that non‑alcoholic fatty liver disease (NAFLD) affects roughly one quarter of the world’s population and that a substantial proportion of these patients progress to advanced fibrosis and cirrhosis. The transition from fibrosis to cirrhosis is driven by complex cellular mechanisms, notably the activation of hepatic stellate cells and the epithelial‑mesenchymal transition (EMT) program, which endow hepatic cells with a profibrogenic phenotype. Consequently, cirrhosis underlies the majority of hepatocellular carcinoma (HCC) cases, with surveillance recommendations emphasizing six‑monthly ultrasonography for early tumor detection.
Accurate staging of liver disease is essential for prognostication and therapeutic decision‑making. The Model for End‑Stage Liver Disease (MELD) score, which incorporates bilirubin, creatinine, INR and disease aetiology, reliably predicts short‑term mortality across diverse cirrhotic cohorts and is now the cornerstone for organ allocation. Non‑invasive biomarkers have been developed to reduce reliance on liver biopsy; indices such as the AST‑to‑Platelet Ratio Index (APRI) and FIB‑4 demonstrate good diagnostic performance for significant fibrosis and cirrhosis in chronic hepatitis C and HIV/HCV coinfection,. Histological scoring systems, exemplified by the NAFLD Activity Score (NAS), provide standardized assessment of disease activity and fibrosis severity, facilitating clinical trials and longitudinal studies.
Therapeutic strategies aim to halt disease progression, reverse fibrosis where possible, and manage complications of portal hypertension. Antiviral treatment of chronic hepatitis B markedly reduces the risk of cirrhosis and HCC, underscoring the importance of viral suppression in disease modification. Emerging antifibrotic agents target key pathways such as TGF‑β signalling, angiotensin II, and leptin‑mediated activation of fibrogenic cells, although most remain investigational. Ultimately, cirrhosis remains a dynamic, potentially reversible condition when underlying etiologies are addressed early, but it also predisposes to life‑threatening sequelae that demand vigilant surveillance and multidisciplinary care.
Results
After extracting gene sets for Cirrhosis from various resources including Enrichr, RummaGEO, Rummagene, Geneshot, MONDO, DO, GWAS Catalog and ClinVar, we try to identify those genes that are understudied for Cirrhosis with fewer publications on PubMed.
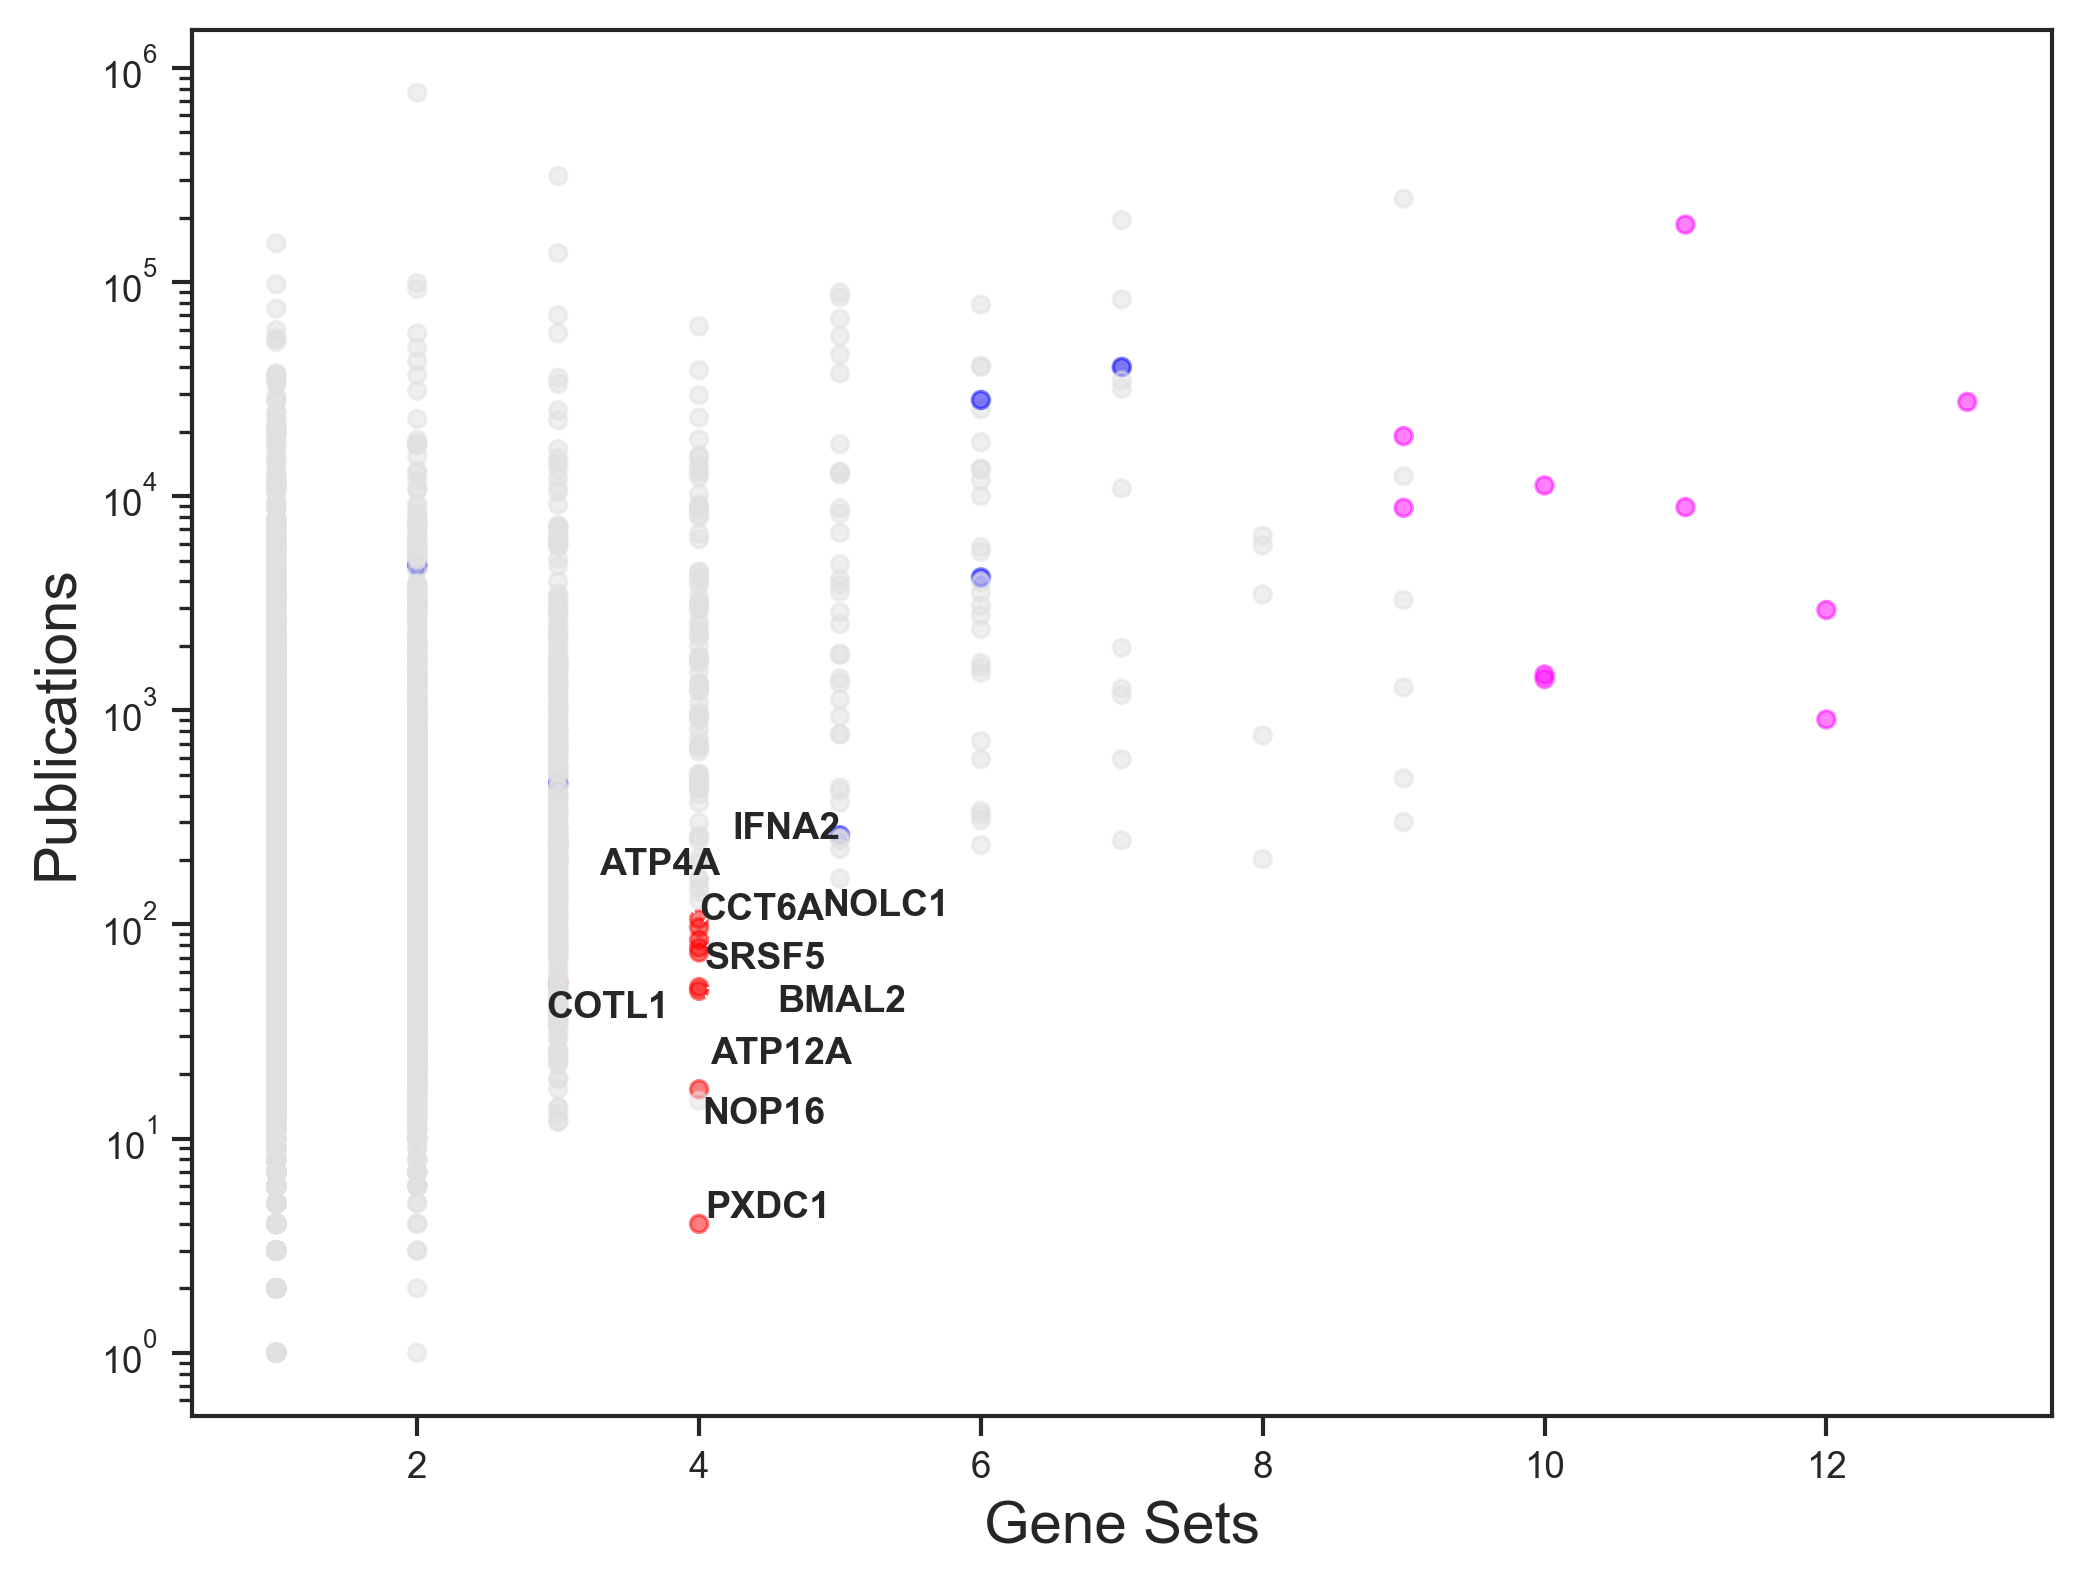
Figure: Scatterplot of publication counts vs gene set counts across all liver gene sets for each of the Cirrhosis genes. Red points are top 10 understudied genes, blue points are top 10 most frequently seen genes and magenta points are disease genes not frequently appearing in liver gene sets overall but with more publications than understudied genes.
In figure 1, we plot publication counts and gene set counts for each Cirrhosis gene using the counts across all liver disease gene sets. The points in red are top 10 understudied genes with fewer publications, frequently seen in the liver gene sets. Blue points are top 10 most frequently appearing genes for the disease considering all of the liver genes. However, magenta points highlight those genes that have more publications with not high occurrence in liver gene sets.
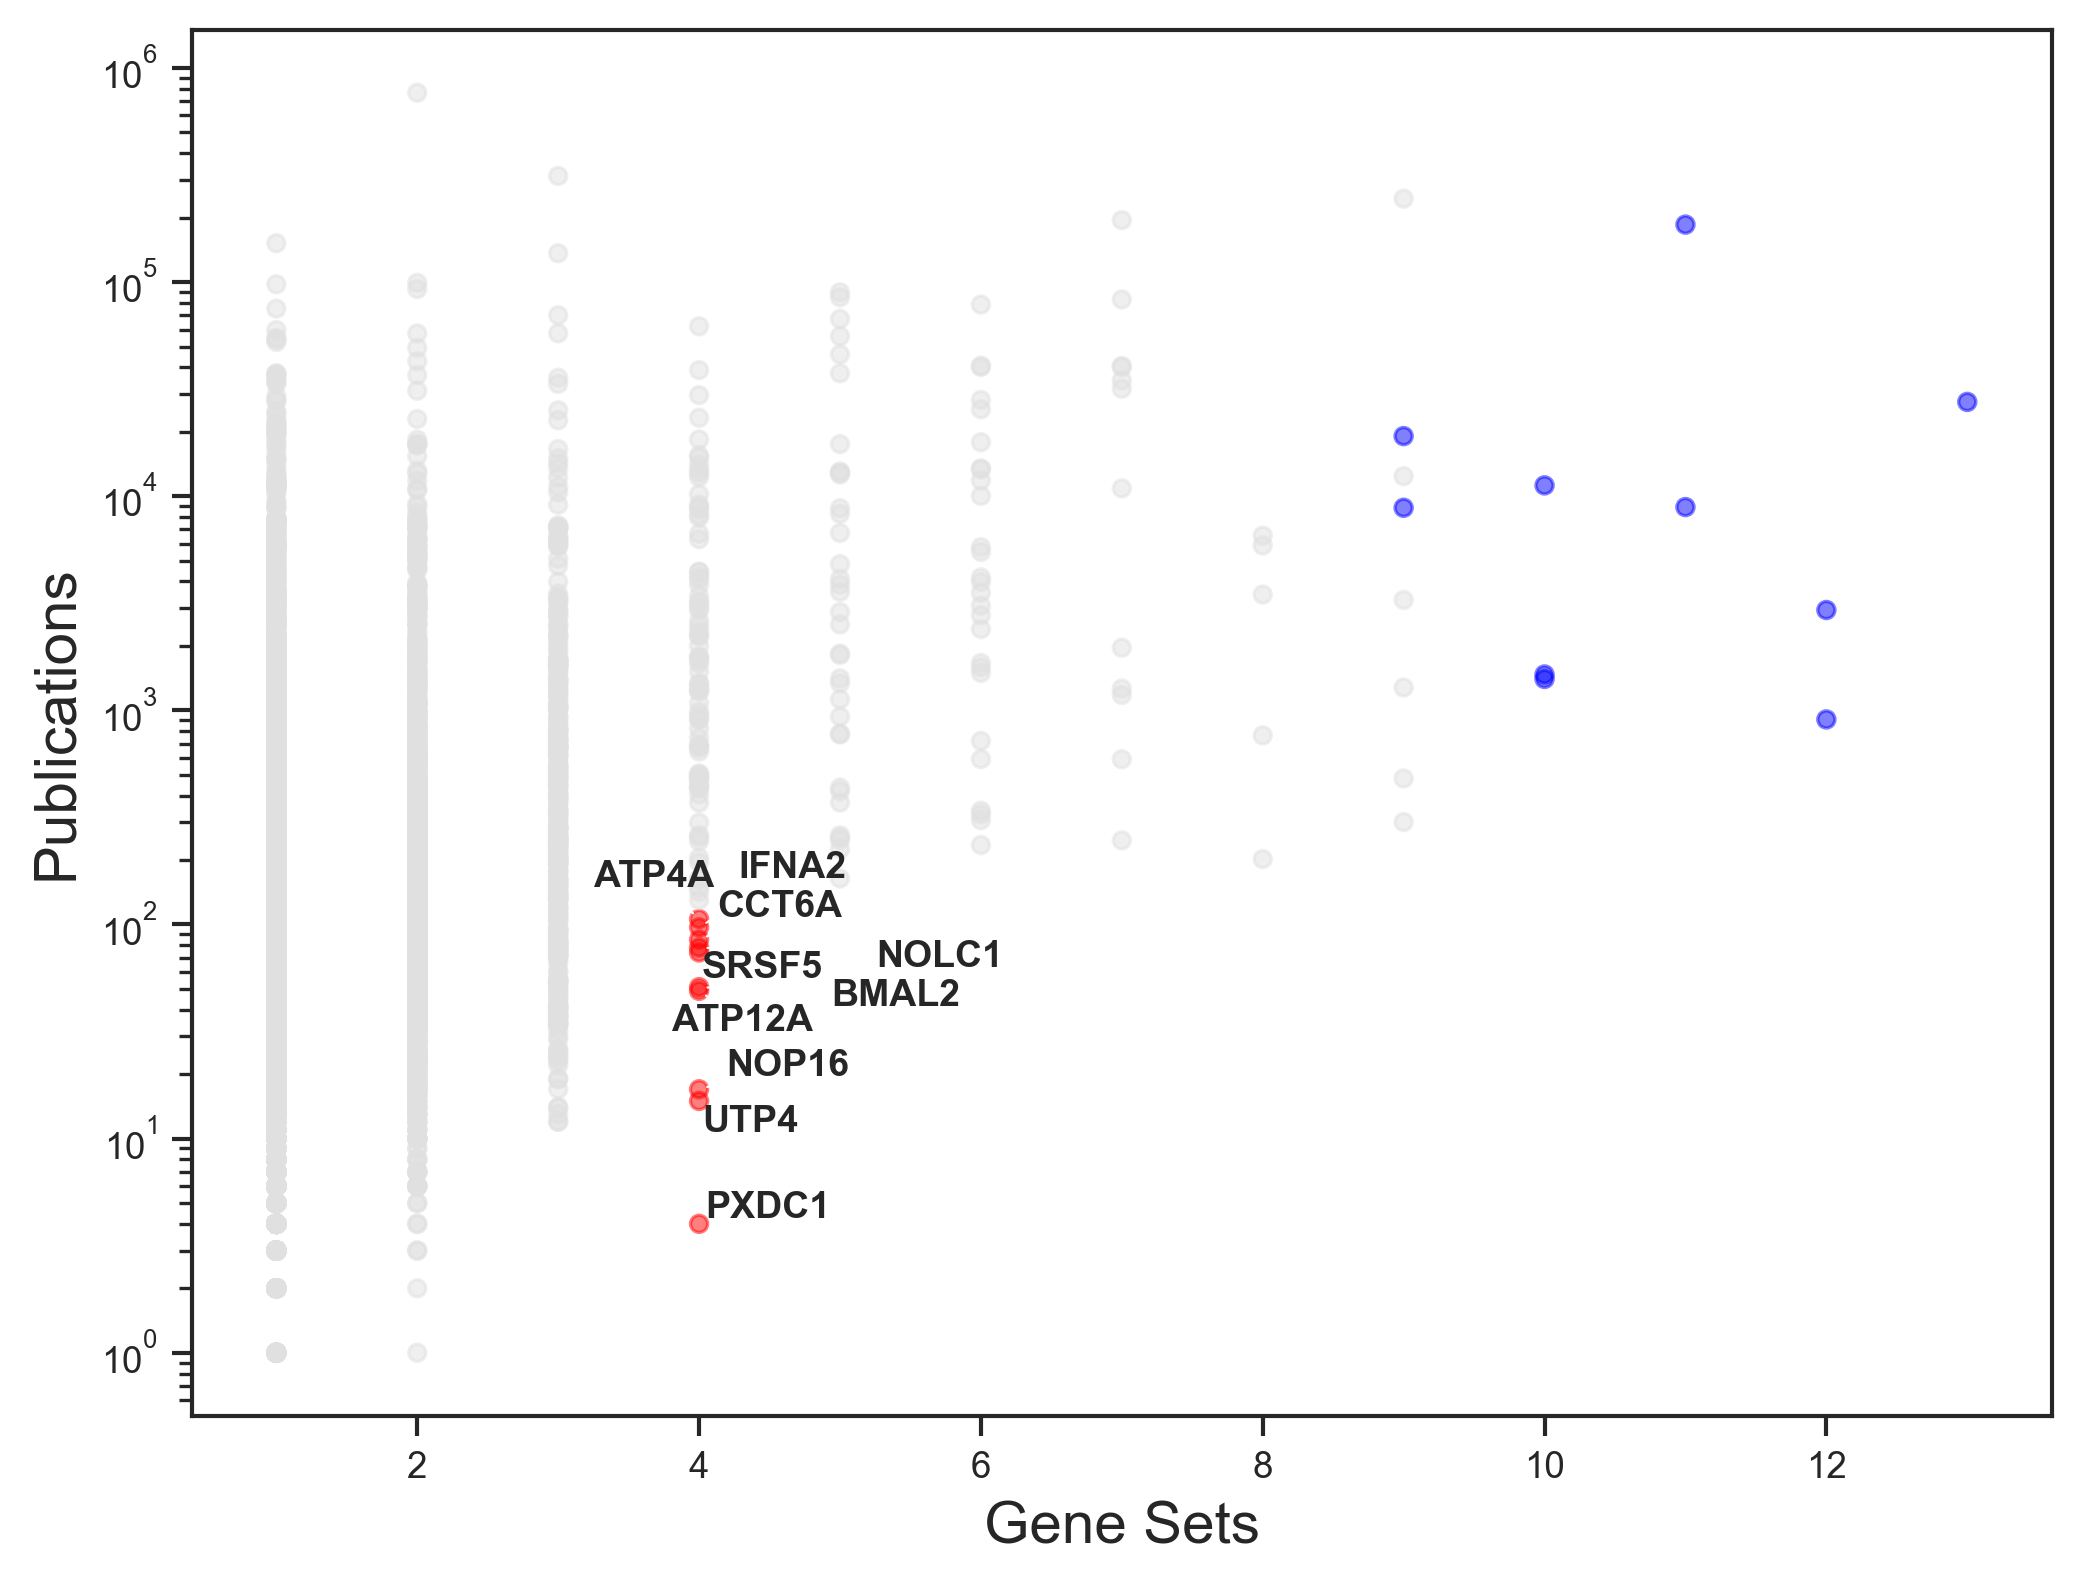
Figure: Scatterplot of publication counts vs gene set counts across only Cirrhosis gene sets for each of the Cirrhosis genes. Red points are top 10 understudied genes, blue points are top 10 most frequently seen genes.
In figure 2, we plot publication counts and gene set counts for each Cirrhosis gene using only the Cirrhosis disease gene sets. The points in red signify top 10 understudied genes with fewer publications and high frequency in Cirrhosis gene sets, while the blue points are top 10 frequently appearing genes in the Cirrhosis gene sets. The top 10 understudied genes for Cirrhosis are - ATP4A, UTP4, CCT6A, ATP12A, NOLC1, IFNA2, SRSF5, BMAL2, NOP16 and PXDC1.
Another approach to get understudied genes for disease could be to use GSFM model to augment the disease genes for Cirrhosis from MONDO resource and get unknown highly related genes for Cirrhosis.
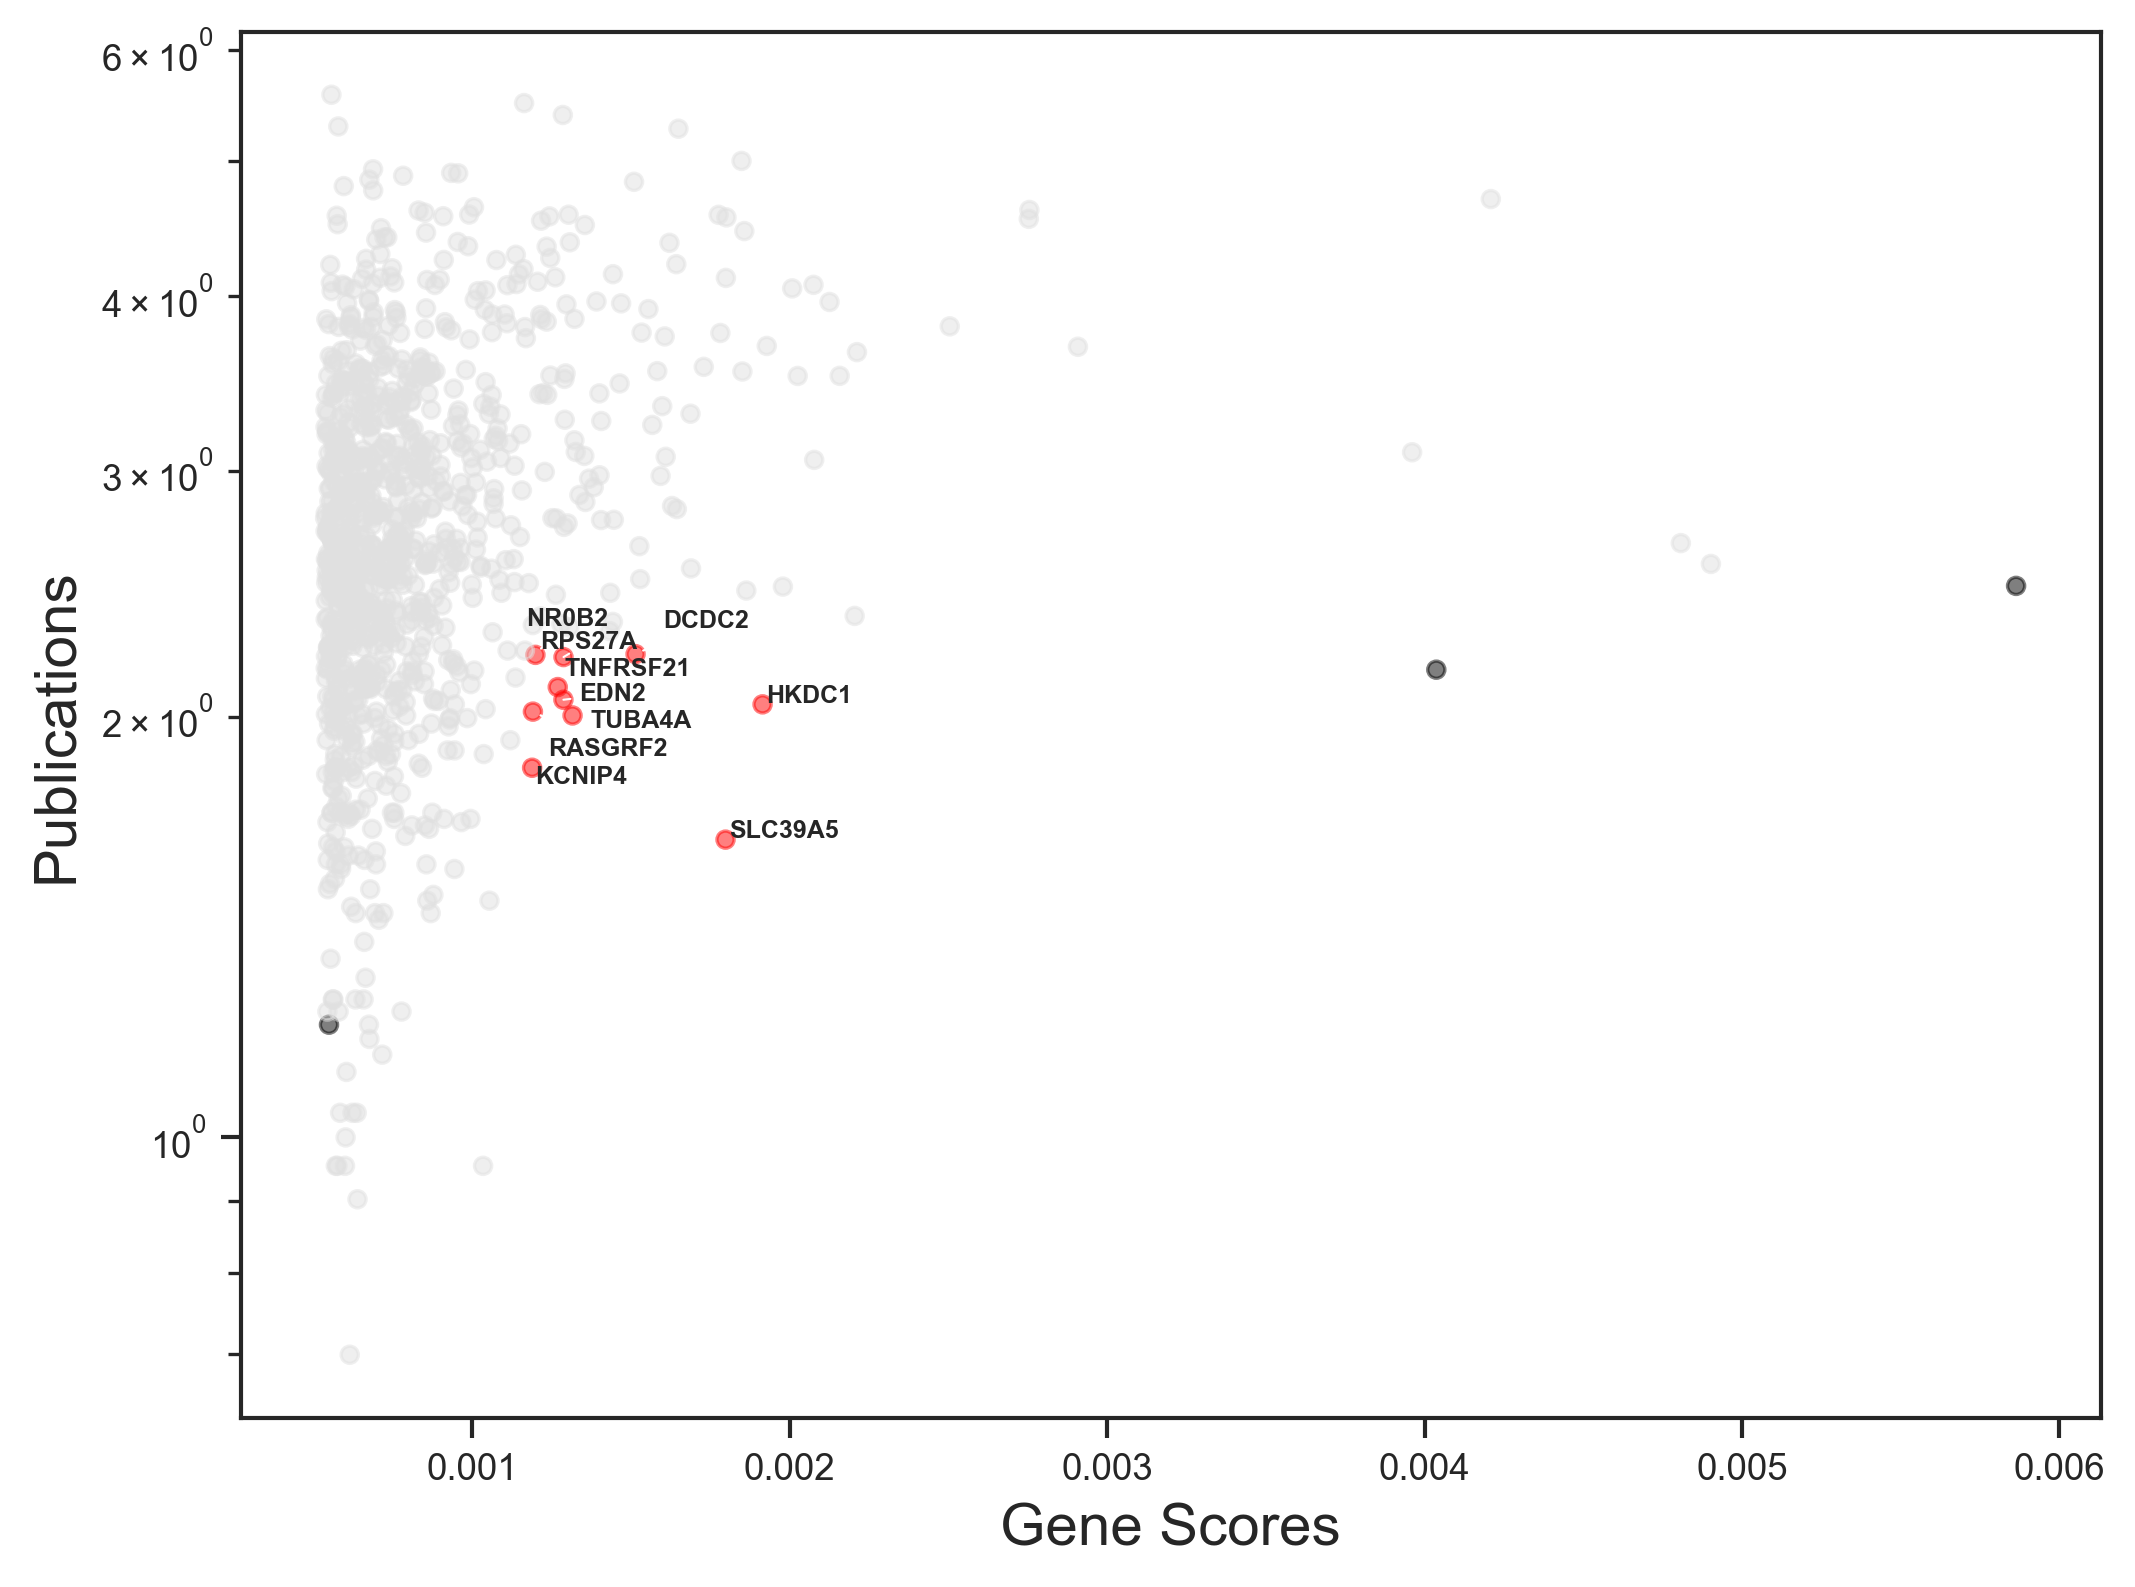
Figure: Scatterplot of publication counts vs GSFM gene scores for each of the predicted Cirrhosis genes. Red points are top 10 understudied genes with high GSFM scores but fewer publications, blue points are top 10 genes with high GSFM scores.
In figure 3, we plot publication counts and GSFM gene scores for each of the predicted Cirrhosis genes from GSFM by augmenting the MONDO disease genes for Cirrhosis. The red points are top 10 genes with fewer publications and high GSFM scores that are not in the input MONDO Cirrhosis genes, while the black points are top 10 genes that have high GSFM scores. The top 10 understudied genes with high GSFM scores not in the disease genes are - TNFRSF21, HKDC1, TUBA4A, NR0B2, DCDC2, RASGRF2, SLC39A5, RPS27A, KCNIP4 and EDN2.
These understudied genes identified might play a unexplored critical role in the pathology of Cirrhosis that should be analyzed further through valid scientific RNA-seq experiments that knockout the genes in the healthy vs Cirrhosis disease samples.
To understand the role these understudied genes play in Cirrhosis pathology, we can find GEO studies where some of these genes are significantly up or down regulated for Cirrhosis. Using RummaGEO, we can get these differentially expressed gene signatures related to Cirrhosis. Details of the GEO studies for these signatures are listed in table 1.
Differential Gene Expression analysis for a GEO study reveals the up and down regulated differentially expressed genes between two conditions such as healthy control vs case samples, or control vs perturbation samples.
For Cirrhosis GEO study GSE254610, raw counts data can be downloaded from NCBI FTP server or from ARCHS4 platform that contains uniformly processed counts data available for all human and mouse GEO studies. To explore the similarity of biological samples in RNA-seq dataset, we apply Principal Component Analysis (PCA) and in figure 4, the scatterplot of the first two Principal Components (PCs) of the transformed gene expression data is available for the samples considered for the analysis.
To perform DGE analysis, Limma-voom, technique is appiled to this raw counts data after clear case and control samples are identified for the study. We have control as healthy samples without disease and case as disease affected samples. Identify differentially expressed genes (DEGs) by P-value < 0.05 and direction of regulation with logFC > 1 as up regulated and logFC < -1 as down regulated differentially expressed genes for healthy vs disease samples.
In figure 5, a volcano plot shows the DEGs identified for GSE254610 study. Since this study contains samples of Healthy and chronic Cirrhosis sample, we get the genes whose expression profiles have significantly changed in the Cirrhosis disease compared to healthy samples.
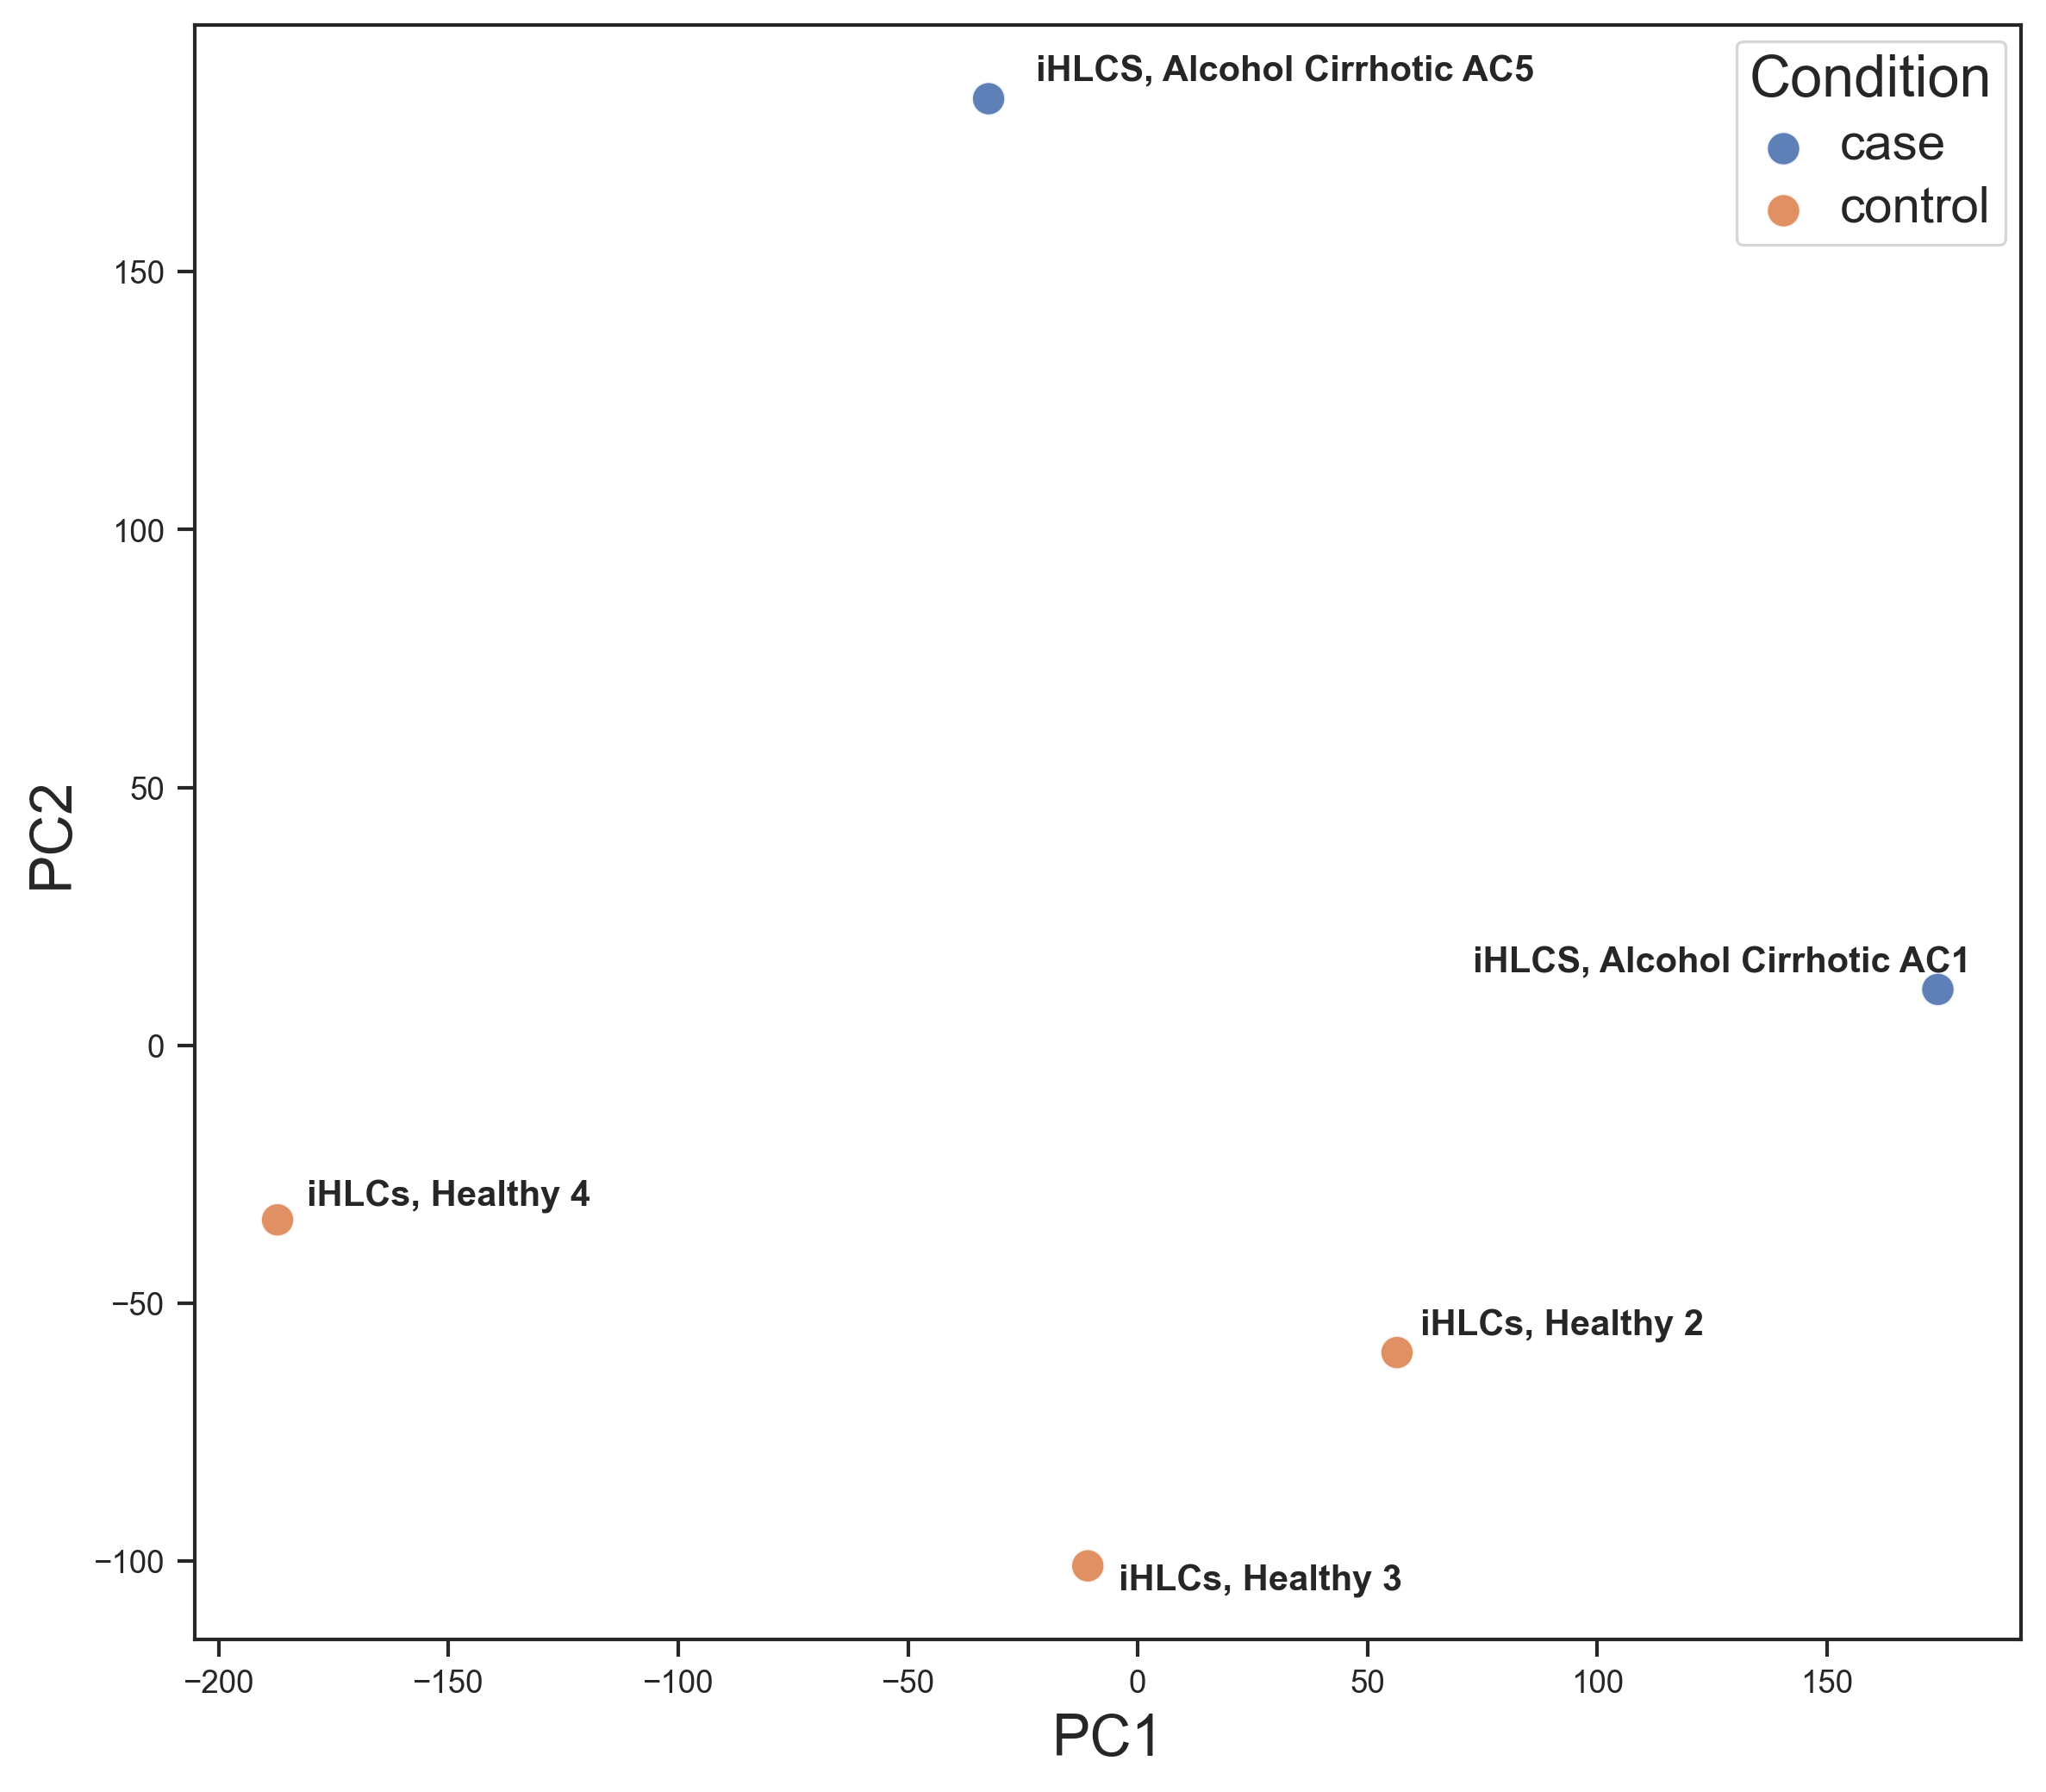
Figure: PCA plot of control and disease samples from the GEO study GSE254610. Blue points are control samples and orange points are disease samples. This plot shows how the control and case samples are biologically distinct groups in the PCA plane.
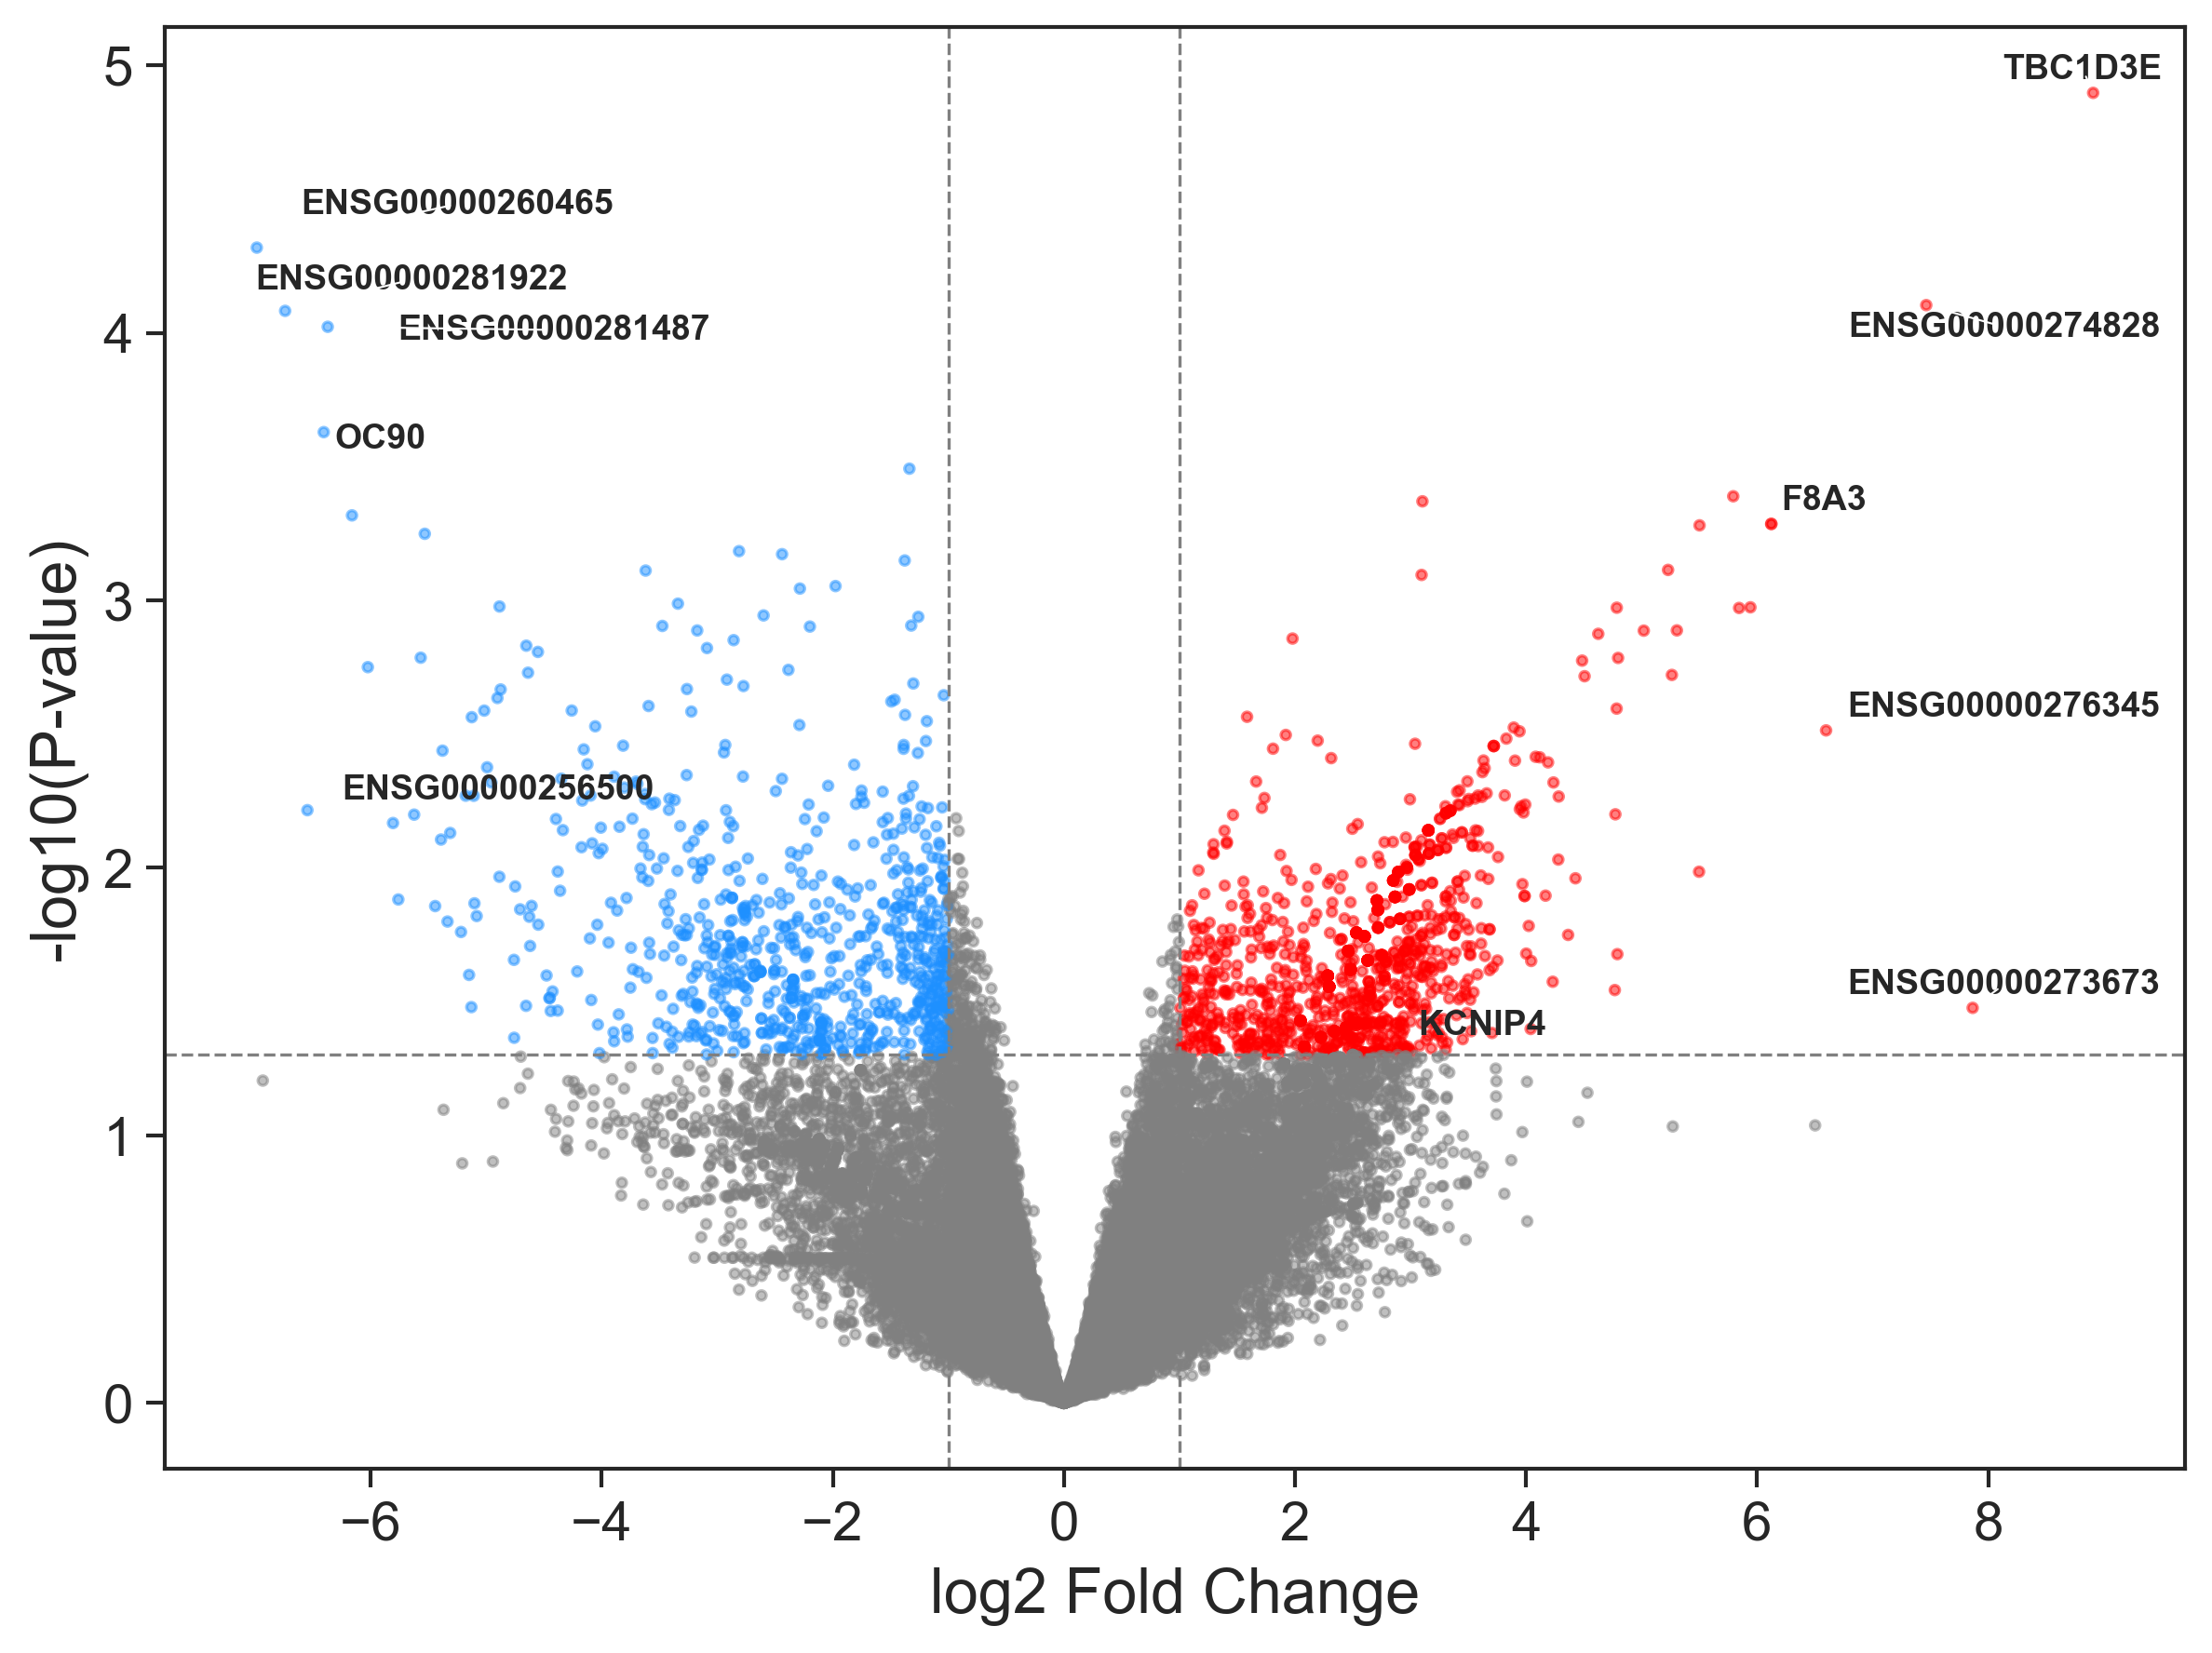
Figure: Volcano plot of P-value and LogFC on the limma-voom results for the GEO study for the Healthy Control vs Cirrhosis samples.
Understudied genes {} {} are significantly down regulated in Cirrhosis samples compared to healthy ones. While understudied genes KCNIP4 {} are up regulated in Cirrhosis samples compared to healthy samples.
For the list of up and down regulated genes we can then perform enrichment analysis using Enrichr API to get enriched terms with these DEGs as input queries as seen in figure 6 and figure 7.
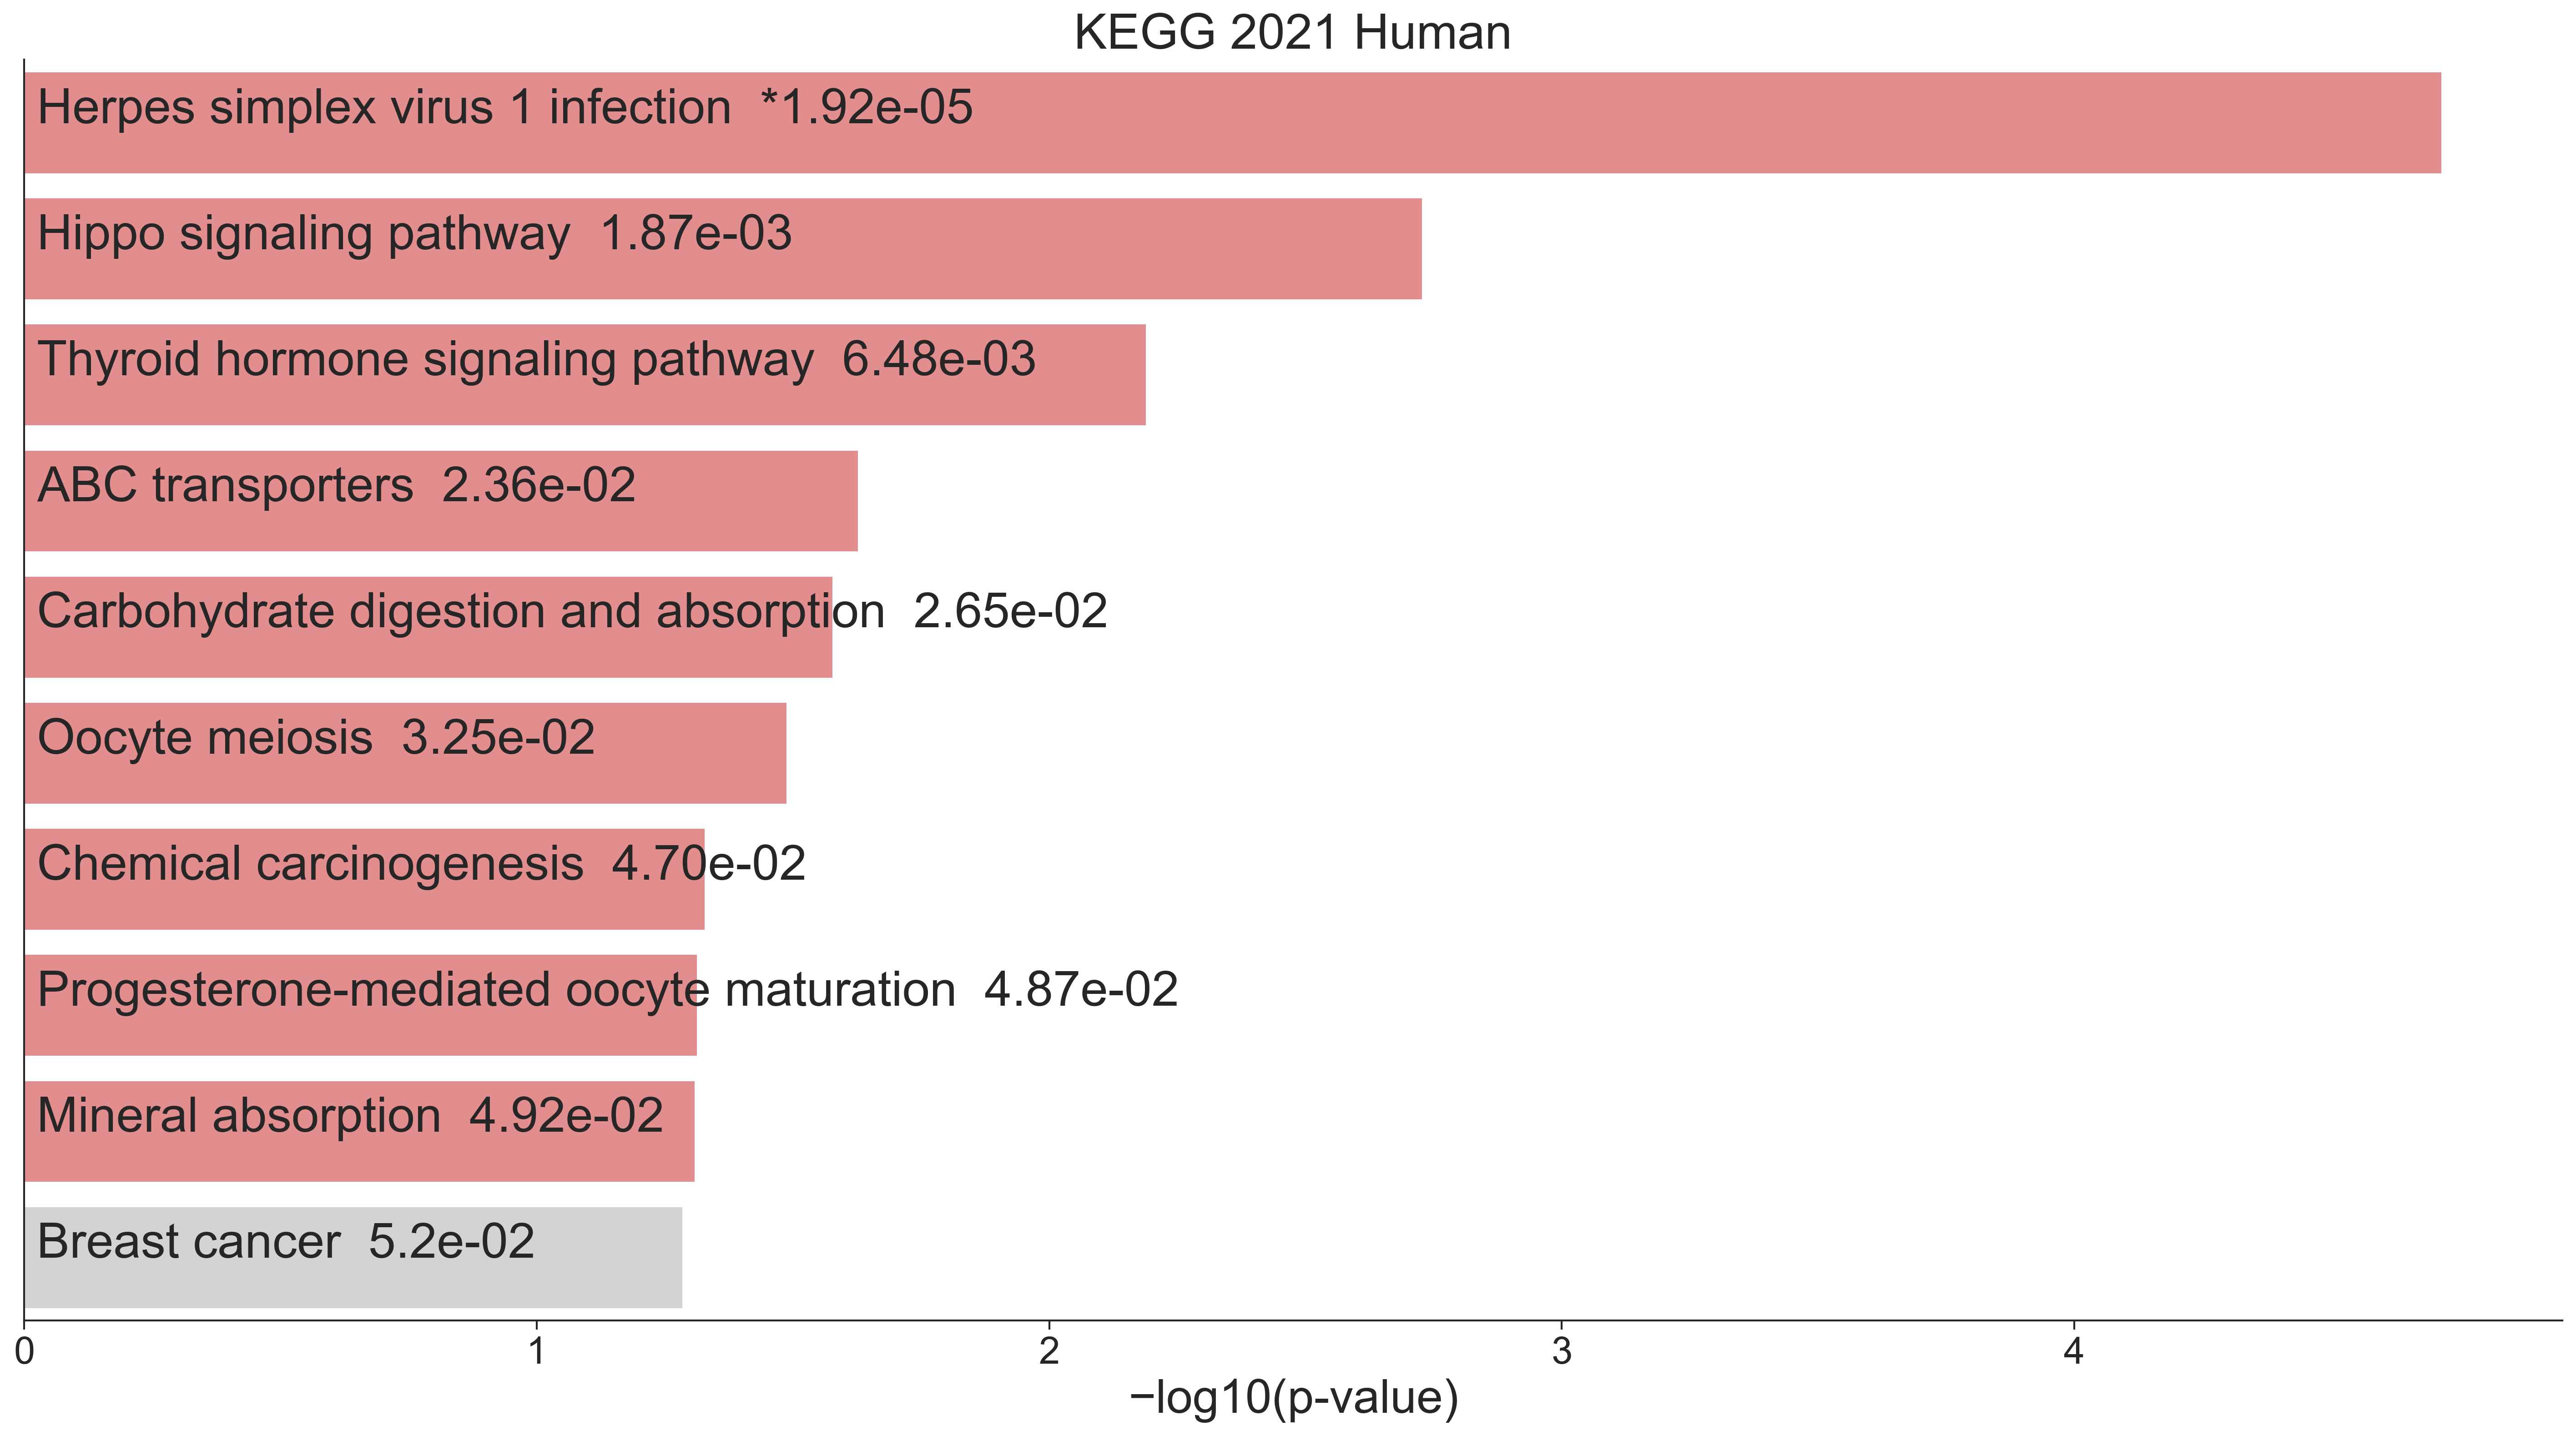
Figure: Bar chart of top enriched terms from the KEGG_2021 Human gene set library. The top 10 enriched terms for the input down gene set are displayed based on the -log10(p-value), with the actual p-value shown next to each term. The term at the top has the most significant overlap with the input down gene set in the case of Healthy Control vs Cirrhosis_
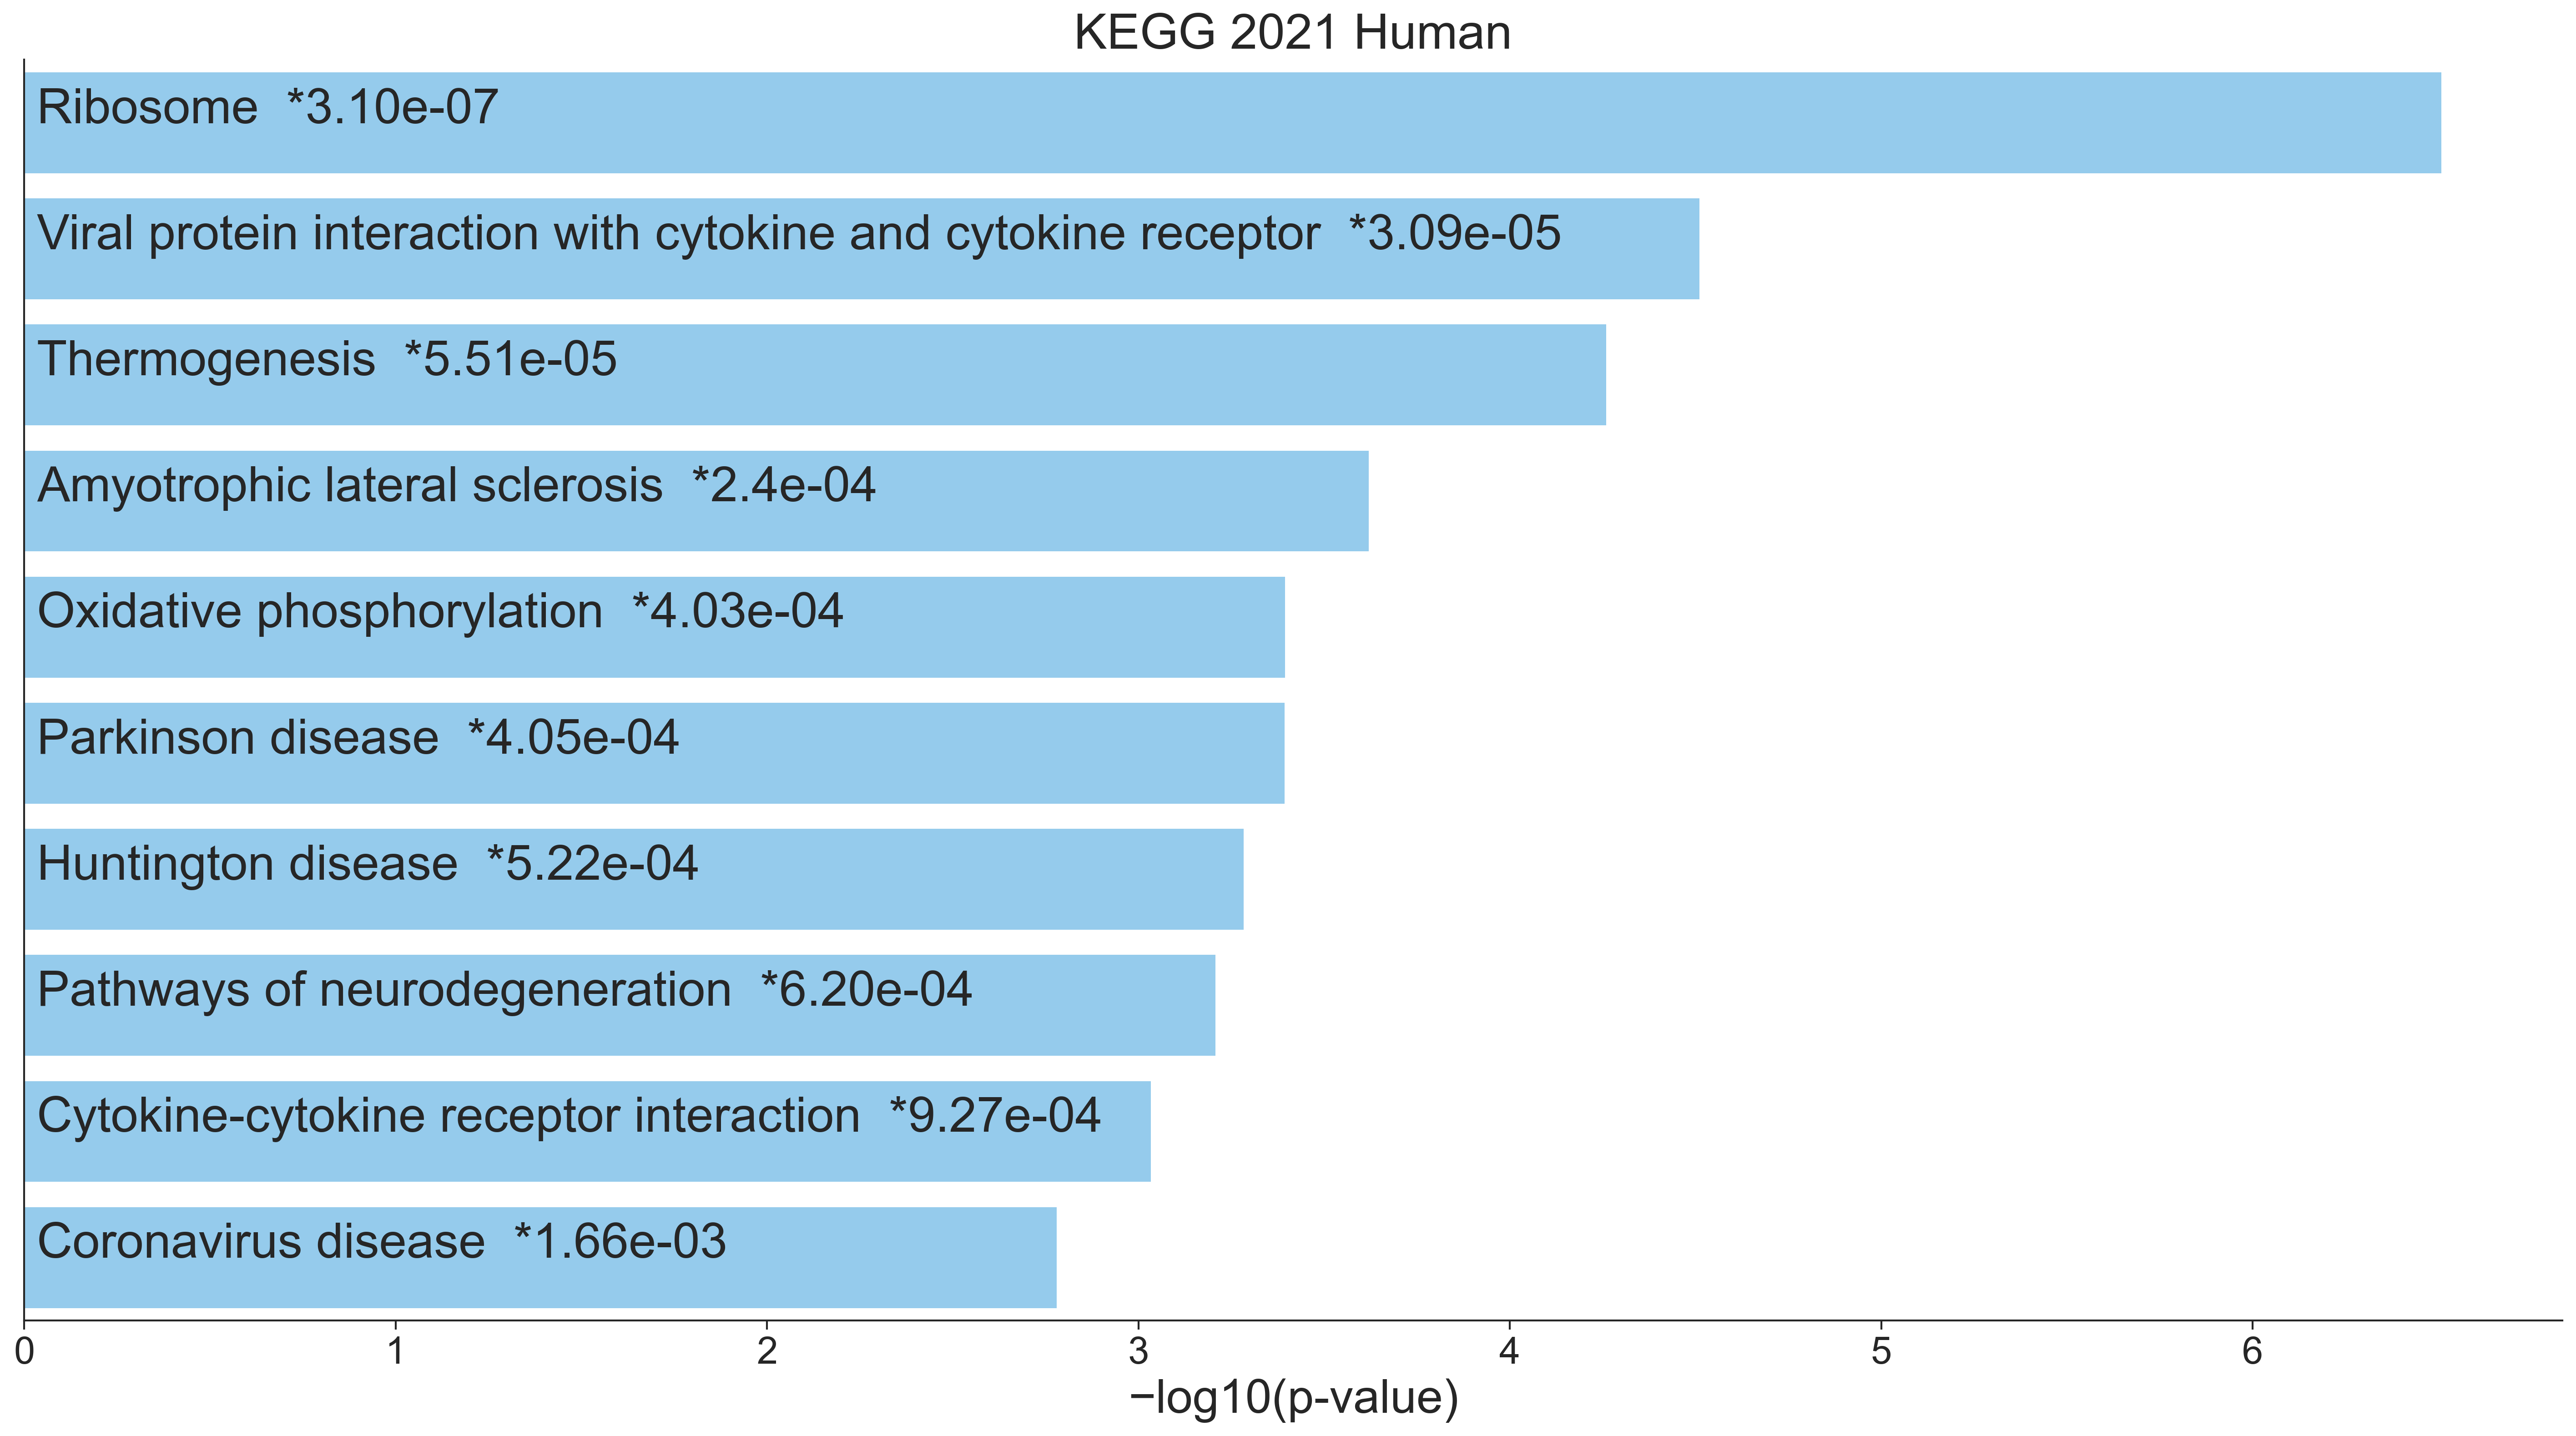
Figure: Bar chart of top enriched terms from the KEGG 2021_ Human gene set library. The top 10 enriched terms for the input up gene set are displayed based on the -log10(p-value), with the actual p-value shown next to each term. The term at the top has the most significant overlap with the input up gene set in the case of Healthy Control vs Cirrhosis_
Using both the up and down genes, we can get drugs, perturbations from L2S2 associated with the gene signatures searched. Details of the drug predictions are available in table 2.
Figure: RummaGEO differential expression signatures for Cirrhosis
Figure: Drug predictions from L2S2 using up and down gene set search
Methods
Detailed introduction on the disease from DeepDive2.0
The introduction section for this article was generated from DeepDive2.0 for Cirrhosis. First, the DeepDive workflow starts from the input disease term in this case "Cirrhosis". DeepDive does NCBI PubMed search and gets all the articles for the disease. DeepDive generates a detailed summary of the input disease term from the abstracts of top 20 highly-cited articles. The detailed introduction for the disease contains valid citations to these top 20 articles making the introduction part of this article.
Potentially understudied genes from disease-associated genes
The gene sets for the Cirrhosis disease was extracted from resources - Enrichr, RummaGEO, Rummagene, Geneshot, MONDO, DO, GWAS Catalog and ClinVar. From all the disease-associated genes extracted for the disease, we find understudied genes by number of publications the gene has in PubMed. Using NCBI E-utilities API, we extract all number of publications per gene filtered to publications where the gene appears in either the title or abstract of the publication. We create 2 scatter plots of publication counts vs frequency of the gene considering all liver diseases gene sets and considering just the Cirrhosis disease gene sets. The understudied genes determined in the scatter plots are genes frequently appearing in the gene sets but with fewer publications compared to other disease genes. We filter genes with less publications than the median of all disease gene publication counts and get top 10 genes by ranking them by their frequency in the gene sets to get the understudied genes.
Understudied genes from GSFM
Another approach to get understudied genes for a disease is using Gene Set Foundation Model (GSFM), to augment the disease genes extracted for the disease from either MONDO or GWAS catalog resource. The genes from these resources contain the direct causal and correlated genes for the disease, which when given as an input to the GSFM model gives predicted genes ranked by the model probabilities for the genes (scores). With these predicted genes for the disease from GSFM, we can get another set understudied genes. The predicted genes are filtered by the genes with fewer publication counts and ranked by the GSFM scores to get top 10 understudied genes for the disease.
Differentially gene expression analysis of a GEO study
From the many GEO studies with up and down signatures for a disease term from RummaGEO, we pick the GEO whose signatures contain most understudied genes found for the disease. We then perform Differentially Gene Expression (DGE) analysis on the gene expression data for the study, GSE254610 for Cirrhosis. We compute the significantly up and down regulated genes comparing healthy control to Cirrhosis samples using Limma-voom, technique. Significantly expressed genes are determined by p-value < 0.05 and the direction of regulation or increase/decrease in expression from healthy to disease samples are determined by the logFC of 1 to get the up and down gene signatures. These up and down genes are given as separate inputs to Enrichr to fetch enrichment results for the input from KEGG 2021 library and these up and down signatures are given together as input for L2S2 up and down signature search to fetch drug predictions for these differentially expressed genes.
Discussion
The present study leveraged a multi‑source integrative pipeline to highlight genes that are repeatedly implicated in cirrhosis‑related gene sets yet remain under‑represented in the biomedical literature. By intersecting disease‑associated gene collections from eight public resources (Enrichr, RummaGEO, Rummagene, Geneshot, MONDO, Disease Ontology, GWAS Catalog, and ClinVar) with PubMed publication counts, we identified two complementary panels of understudied candidates:
- Frequency‑driven understudied genes – ten genes (e.g., ATP4A, UTP4, CCT6A) that appear frequently across liver‑disease gene sets but have fewer than median PubMed mentions.
- GSFM‑driven understudied genes – ten genes (e.g., TNFRSF21, HKDC1, NR0B2) that receive high predictive scores from the Gene Set Foundational Model yet are sparsely cited.
Both panels were independently validated by differential expression analysis of the cirrhosis GEO dataset GSE254610. Several of the frequency‑driven genes (e.g., ATP12A, IFNA2) were significantly down‑regulated in cirrhotic liver tissue, whereas a GSFM‑derived gene (KCNIP4) showed up‑regulation. Enrichment of the resulting up‑ and down‑regulated signatures in KEGG pathways highlighted metabolic and inflammatory processes that are central to cirrhosis pathobiology, supporting the biological relevance of these overlooked genes.
Implications for cirrhosis biology
The identified genes span diverse functional categories, including ion transport (ATP4A, ATP12A), RNA processing (CCT6A, SRSF5), circadian regulation (BMAL2), and signaling receptors (TNFRSF21). Their recurrent appearance in liver‑centric gene sets suggests that they may contribute to key mechanisms such as hepatic stellate cell activation, extracellular matrix remodeling, or metabolic re‑programming—processes that are already known to drive fibrosis and its progression to cirrhosis. Because these genes have escaped extensive experimental scrutiny, they represent a fertile ground for hypothesis‑driven investigations that could uncover novel therapeutic targets or biomarkers.
Methodological strengths
The workflow combined orthogonal strategies—literature‑based filtering and machine‑learning‑based prediction—thereby reducing reliance on any single data source. The use of GSFM, a foundation model trained on large‑scale gene‑set data, allowed us to extrapolate beyond curated disease‑gene lists and capture latent functional relationships. Moreover, the incorporation of real‑world transcriptomic evidence (GEO DGE analysis) provided an empirical layer of validation, strengthening confidence that the shortlisted genes are not merely computational artefacts.
Limitations
Several caveats must be acknowledged. First, publication count is an imperfect proxy for scientific attention; some genes may be studied extensively under alternative nomenclatures or within broader pathways, leading to underestimation of their true research footprint. Second, the gene‑set resources employed vary in curation depth and disease specificity; biases inherent to any single database could influence the frequency metrics. Third, the DGE validation relied on a single cirrhosis cohort (alcohol‑associated disease), which may not capture the full heterogeneity of etiologies such as NAFLD‑related or viral cirrhosis. Finally, the GSFM model, while powerful, is limited by the quality of its training data and may propagate existing annotation gaps.
Future directions
To translate these findings into mechanistic insight, the following steps are recommended:
- Targeted functional assays: CRISPR‑mediated knockout or over‑expression of the top understudied genes in primary human hepatic stellate cells and hepatocytes, followed by assessment of fibrogenic markers (e.g., ``‑SMA, collagen I) and cellular phenotypes (proliferation, migration).
- Cross‑cohort validation: Replicate the differential expression analysis across independent cirrhosis datasets representing diverse aetiologies (viral, metabolic, cholestatic) to confirm the consistency of gene regulation patterns.
- Network integration: Map the understudied genes onto protein‑protein interaction and signaling networks to identify upstream regulators or downstream effectors, potentially revealing points of therapeutic intervention.
- Drug repurposing exploration: Leverage the L2S2 drug prediction results to test candidate compounds (e.g., CHIR‑99021, flutamide) in vitro and in vivo models, focusing on whether modulation of the newly identified genes mediates therapeutic effects.
- Clinical correlation: Examine whether expression levels of these genes correlate with clinical outcomes (MELD score, progression to decompensation) in patient cohorts, which could inform biomarker development.
Conclusion
By systematically integrating disease‑gene annotations, literature metrics, and predictive modeling, we have uncovered a set of under‑studied genes that are plausibly involved in cirrhosis pathogenesis. The convergence of computational prioritization with transcriptomic evidence underscores their potential relevance and provides a concrete roadmap for experimental validation. Expanding our understanding of these neglected players may ultimately enrich the therapeutic arsenal against cirrhosis and its sequelae.
Acknowledgements
This manuscript used assistance from the Ollama GPT ‑OSS:120b large language model and DeepDive2.0 resource.
References
-
Younossi (2016) Global epidemiology of nonalcoholic fatty liver disease—Meta‑analytic assessment of prevalence, incidence, and outcomes. Hepatology. DOI: 10.1002/hep.28431 ↩
-
Bataller (2005) Liver fibrosis. Journal of Clinical Investigation. DOI: 10.1172/JCI24282 ↩ ↩2
-
Kalluri (2009) The basics of epithelial-mesenchymal transition. Journal of Clinical Investigation. DOI: 10.1172/JCI39104 ↩
-
Thiery (2009) Epithelial-mesenchymal transitions in development and disease. Cell. DOI: 10.1016/j.cell.2009.11.007 ↩
-
Nieto (2016) EMT: 2016. Cell. DOI: 10.1016/j.cell.2016.06.028 ↩
-
Forner (2018) Hepatocellular carcinoma. Lancet. DOI: 10.1016/S0140-6736(18)30010-2 ↩
-
El‑Serag (2007) Hepatocellular carcinoma: epidemiology and molecular carcinogenesis. Gastroenterology. DOI: 10.1053/j.gastro.2007.04.061 ↩
-
Forner (2012) Hepatocellular carcinoma. Lancet. DOI: 10.1016/S0140-6736(11)61347-0 ↩
-
Llovet (2003) Hepatocellular carcinoma. Lancet. DOI: 10.1016/S0140-6736(03)14964-1 ↩
-
Kamath (2001) A model to predict survival in patients with end‑stage liver disease. Hepatology. DOI: 10.1053/jhep.2001.22172 ↩
-
Wai (2003) A simple noninvasive index can predict both significant fibrosis and cirrhosis in patients with chronic hepatitis C. Hepatology. DOI: 10.1053/jhep.2003.50346 ↩
-
Sterling (2006) Development of a simple noninvasive index to predict significant fibrosis in patients with HIV/HCV coinfection. Hepatology. DOI: 10.1002/hep.21178 ↩
-
Kleiner (2005) Design and validation of a histological scoring system for nonalcoholic fatty liver disease. Hepatology. DOI: 10.1002/hep.20701 ↩
-
{European Association for the Study of the Liver (2017) EASL 2017 Clinical Practice Guidelines on the management of hepatitis B virus infection. Journal of Hepatology. DOI: 10.1016/j.jhep.2017.03.021 ↩
-
Lachmann (2018) Massive mining of publicly available RNA-seq data from human and mouse. Nature Communications. DOI: 10.1038/s41467-018-03751-6 ↩
-
Law (2014) voom: precision weights unlock linear model analysis tools for RNA-seq read counts. Genome Biology. DOI: 10.1186/gb-2014-15-2-r29 ↩ ↩2
-
Ritchie (2015) limma powers differential expression analyses for RNA-sequencing and microarray studies. Nucleic Acids Research. DOI: 10.1093/nar/gkv007 ↩ ↩2
-
Xie (2021) Gene Set Knowledge Discovery with Enrichr. Current Protocols. DOI: 10.1002/cpz1.90 ↩ ↩2 ↩3
-
Marino (2025) L2S2: chemical perturbation and CRISPR KO LINCS L1000 signature search engine. Nucleic Acids Research. DOI: 10.1093/nar/gkaf373 ↩ ↩2
-
Marino (2025) L2S2: chemical perturbation and CRISPR KO LINCS L1000 signature search engine. Nucleic Acids Research. DOI: doi:10.1093/nar/gkaf373 ↩ ↩2
-
Clarke (2024) Rummagene: massive mining of gene sets from supporting materials of biomedical research publications. Communications Biology. DOI: 10.1038/s42003-024-06177-7 ↩
-
Lachmann (2019) Geneshot: search engine for ranking genes from arbitrary text queries. Nucleic Acids Research. DOI: 10.1093/nar/gkz393 ↩
-
Vasilevsky (2025) Mondo: Integrating Disease Terminology Across Communities. Genetics. DOI: 10.1093/genetics/iyaf215 ↩ ↩2
-
Schriml (2022) The Human Disease Ontology 2022 update. Nucleic Acids Research. DOI: 0.1093/nar/gkab1063 ↩
-
Buniello (2019) The NHGRI-EBI GWAS Catalog of published genome-wide association studies, targeted arrays and summary statistics. Nucleic Acids Research. DOI: 10.1093/nar/gky1120 ↩ ↩2
-
L (2014) ClinVar: public archive of relationships among sequence variation and human phenotype. Nucleic Acids Research. DOI: 10.1093/nar/gkt1113 ↩
-
Clarke (2025) A Gene Set Foundation Model Pre-Trained on a Massive Collection of Diverse Gene Sets. Preprint on bioRxiv. DOI: 10.1101/2025.05.30.657124 ↩
Peer review
No reviews yet.
History
Sign in to comment.